Investigate Slow System Response Time
When you need to investigate slow response time on a system, many different issues could be causing the problem. The following steps explain one path of many you could follow as you investigate.
-
Select the focus system associated with the trouble ticket.
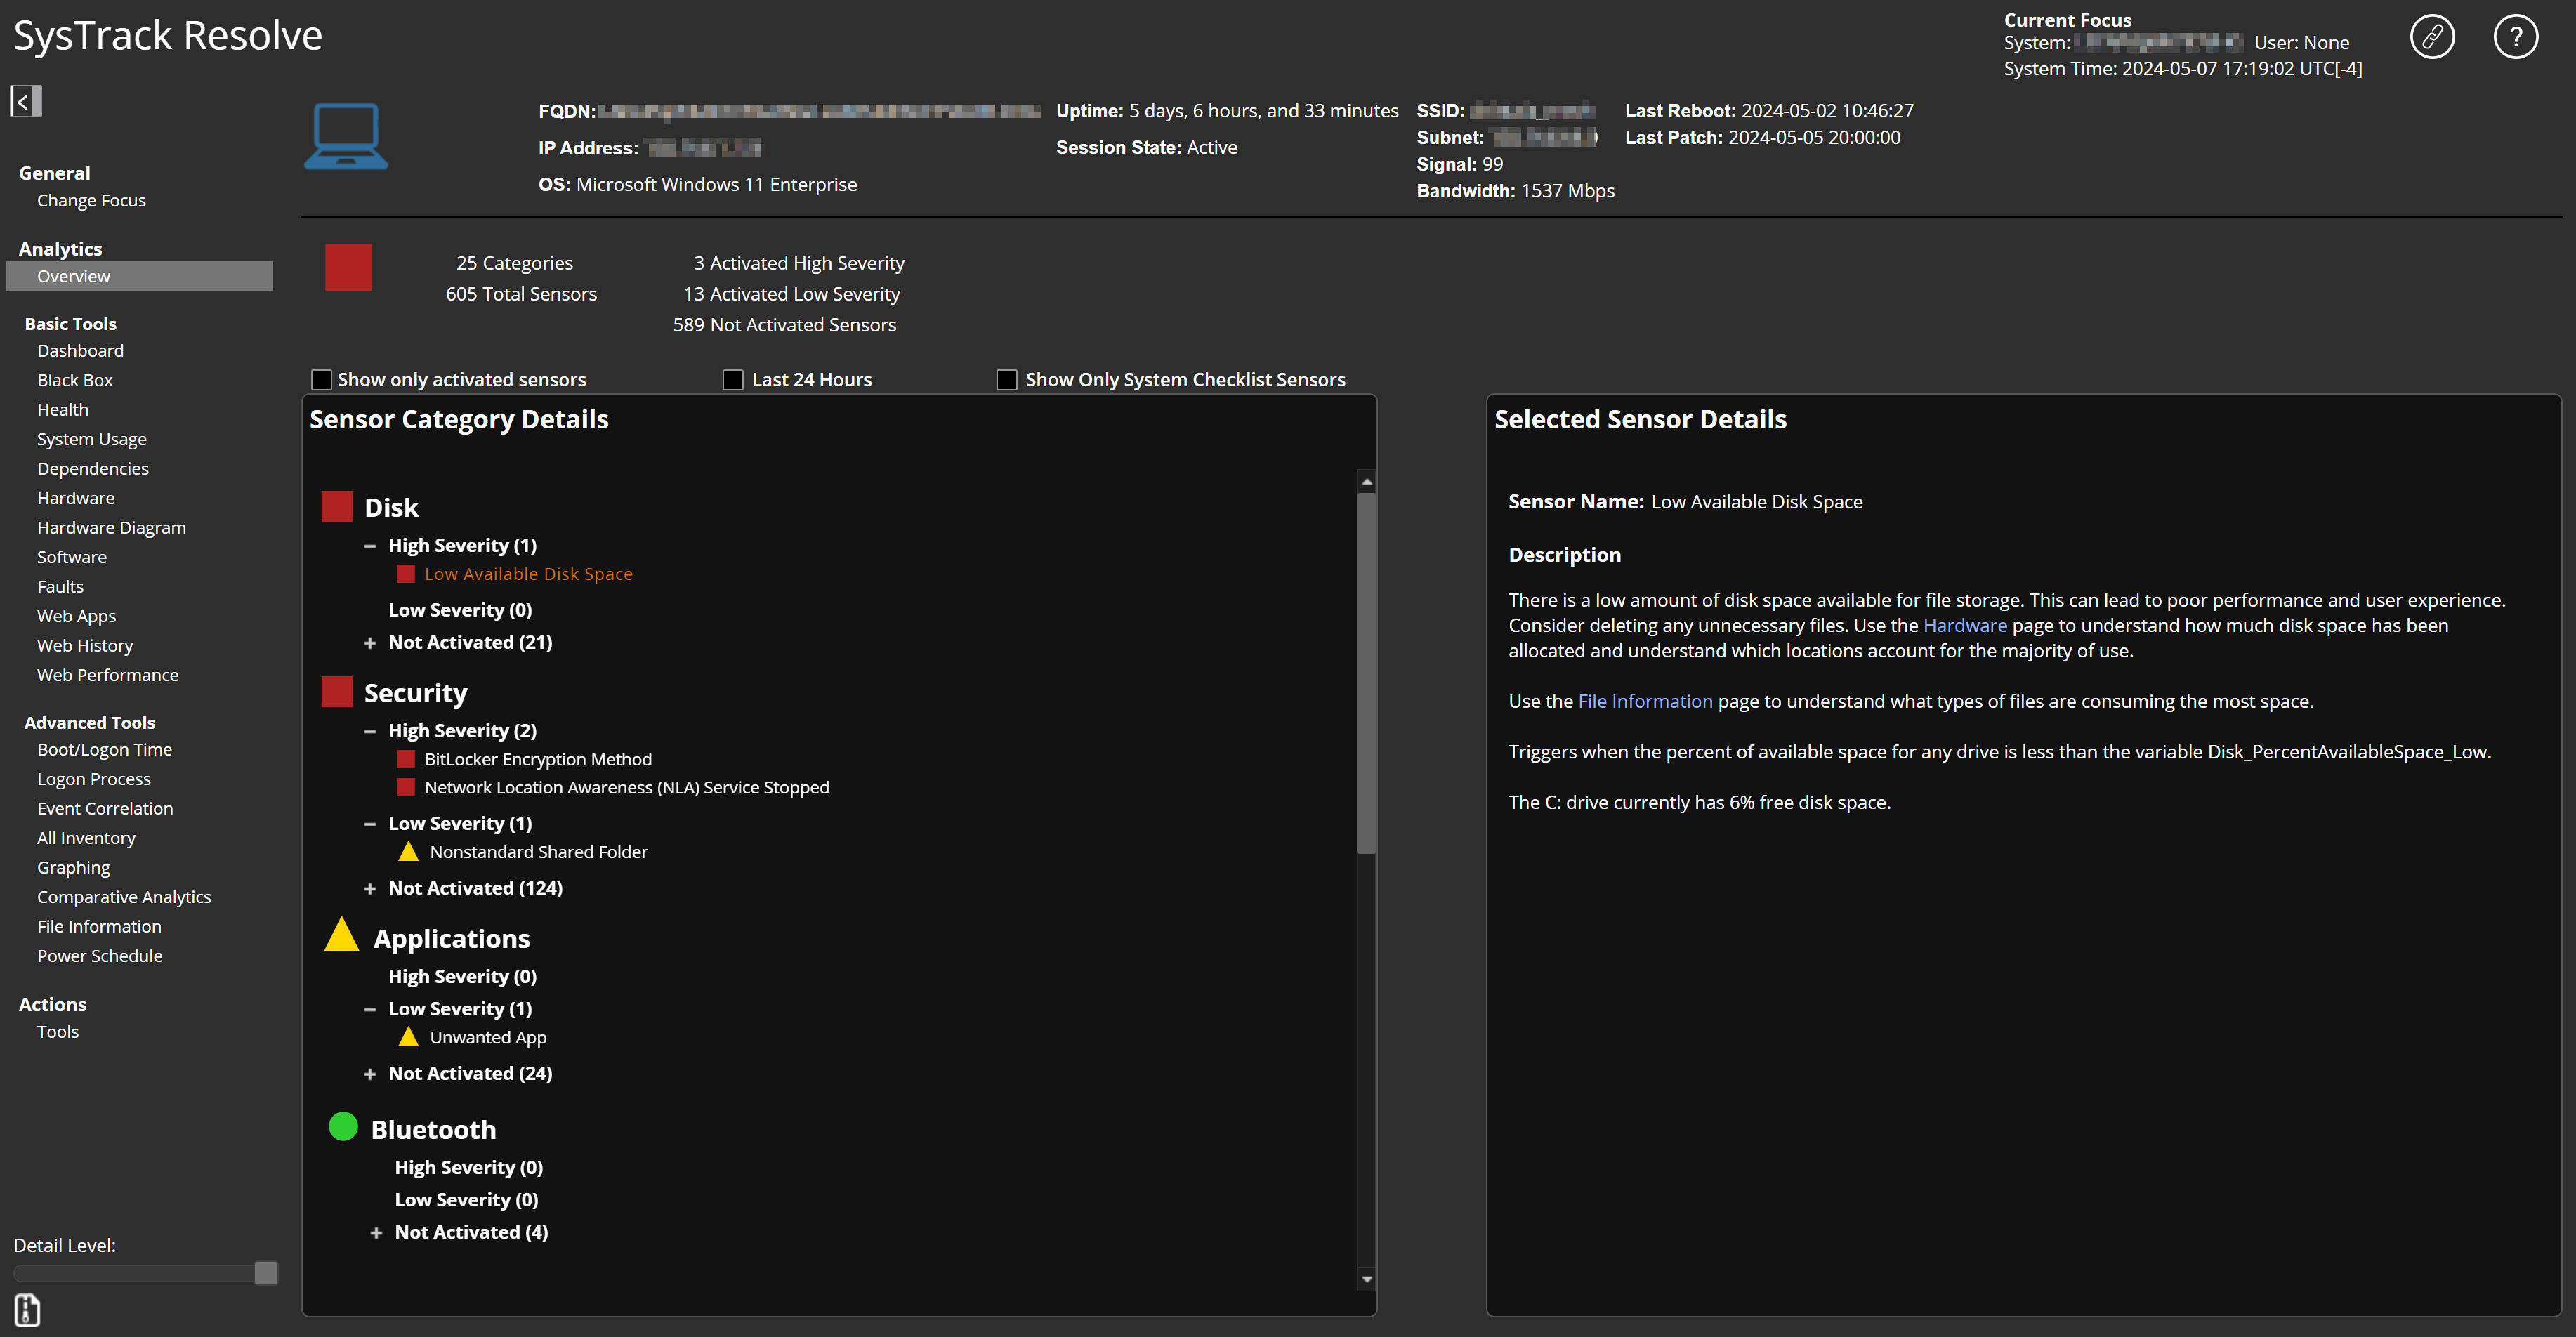
Resolve connects directly to the selected system and executes a diagnostic routine. Resolve's Overview page opens, displaying the system's diagnostics results.
-
Under Sensor Category Details, review the sensors that have High Severity or Low Severity icons. Details for the highest severity sensor display by default. Click a sensor name under Sensor Category Details to see a detailed description and recommended corrective action on the right under Selected Sensor Details.
-
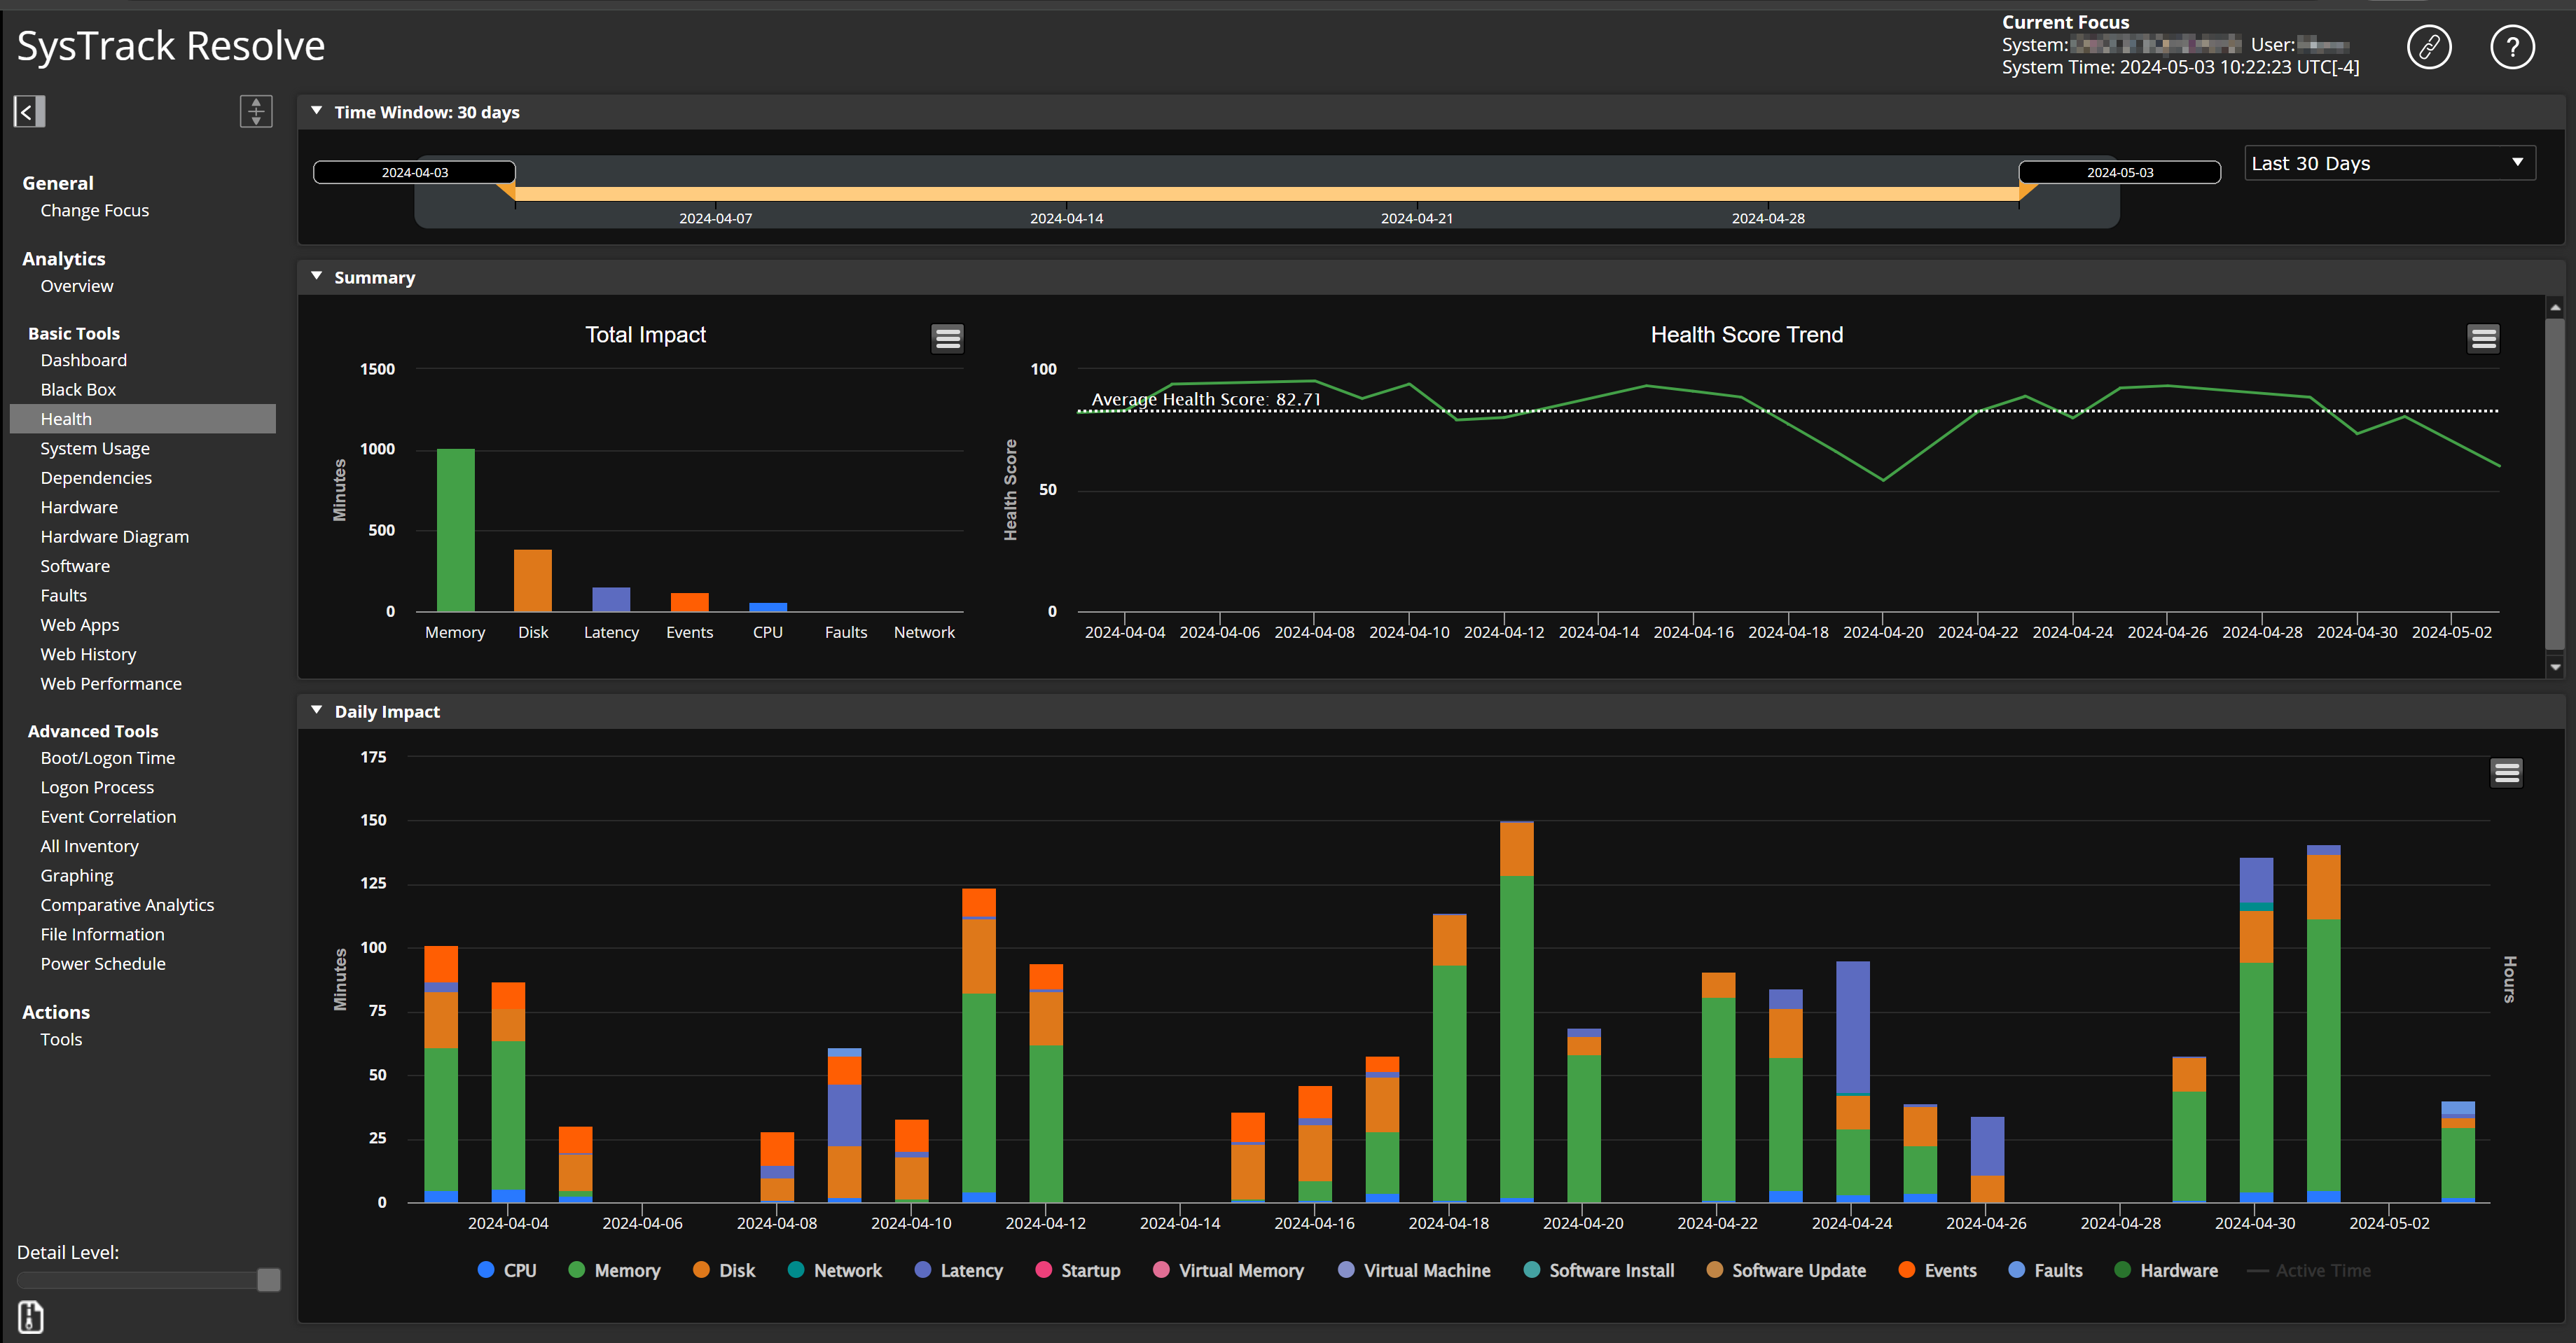
Select the Health tool.
The Health tool helps you determine which categories that are impacting the system's health could be contributing to a slow system response time. The Total Impact graph breaks out the categories that have impacted the system's performance. The value displayed for each category is the total number of minutes that the category has impacted the system's performance over the last 30 days.
EXAMPLE: You see that Latency is a relatively large contributor. You hover over the Daily Impact bar graph to see the total number of minutes the category has impacted the system's performance over the last 30 days. The bars at each date point are broken into color-coded category segments. You hover over a category segment to see that category's impact minutes for the indicated date.
-
The tool you use next to continue your investigation depends on the Health categories you see that have the highest impact on the system's health and could be contributing to the slow system response time.
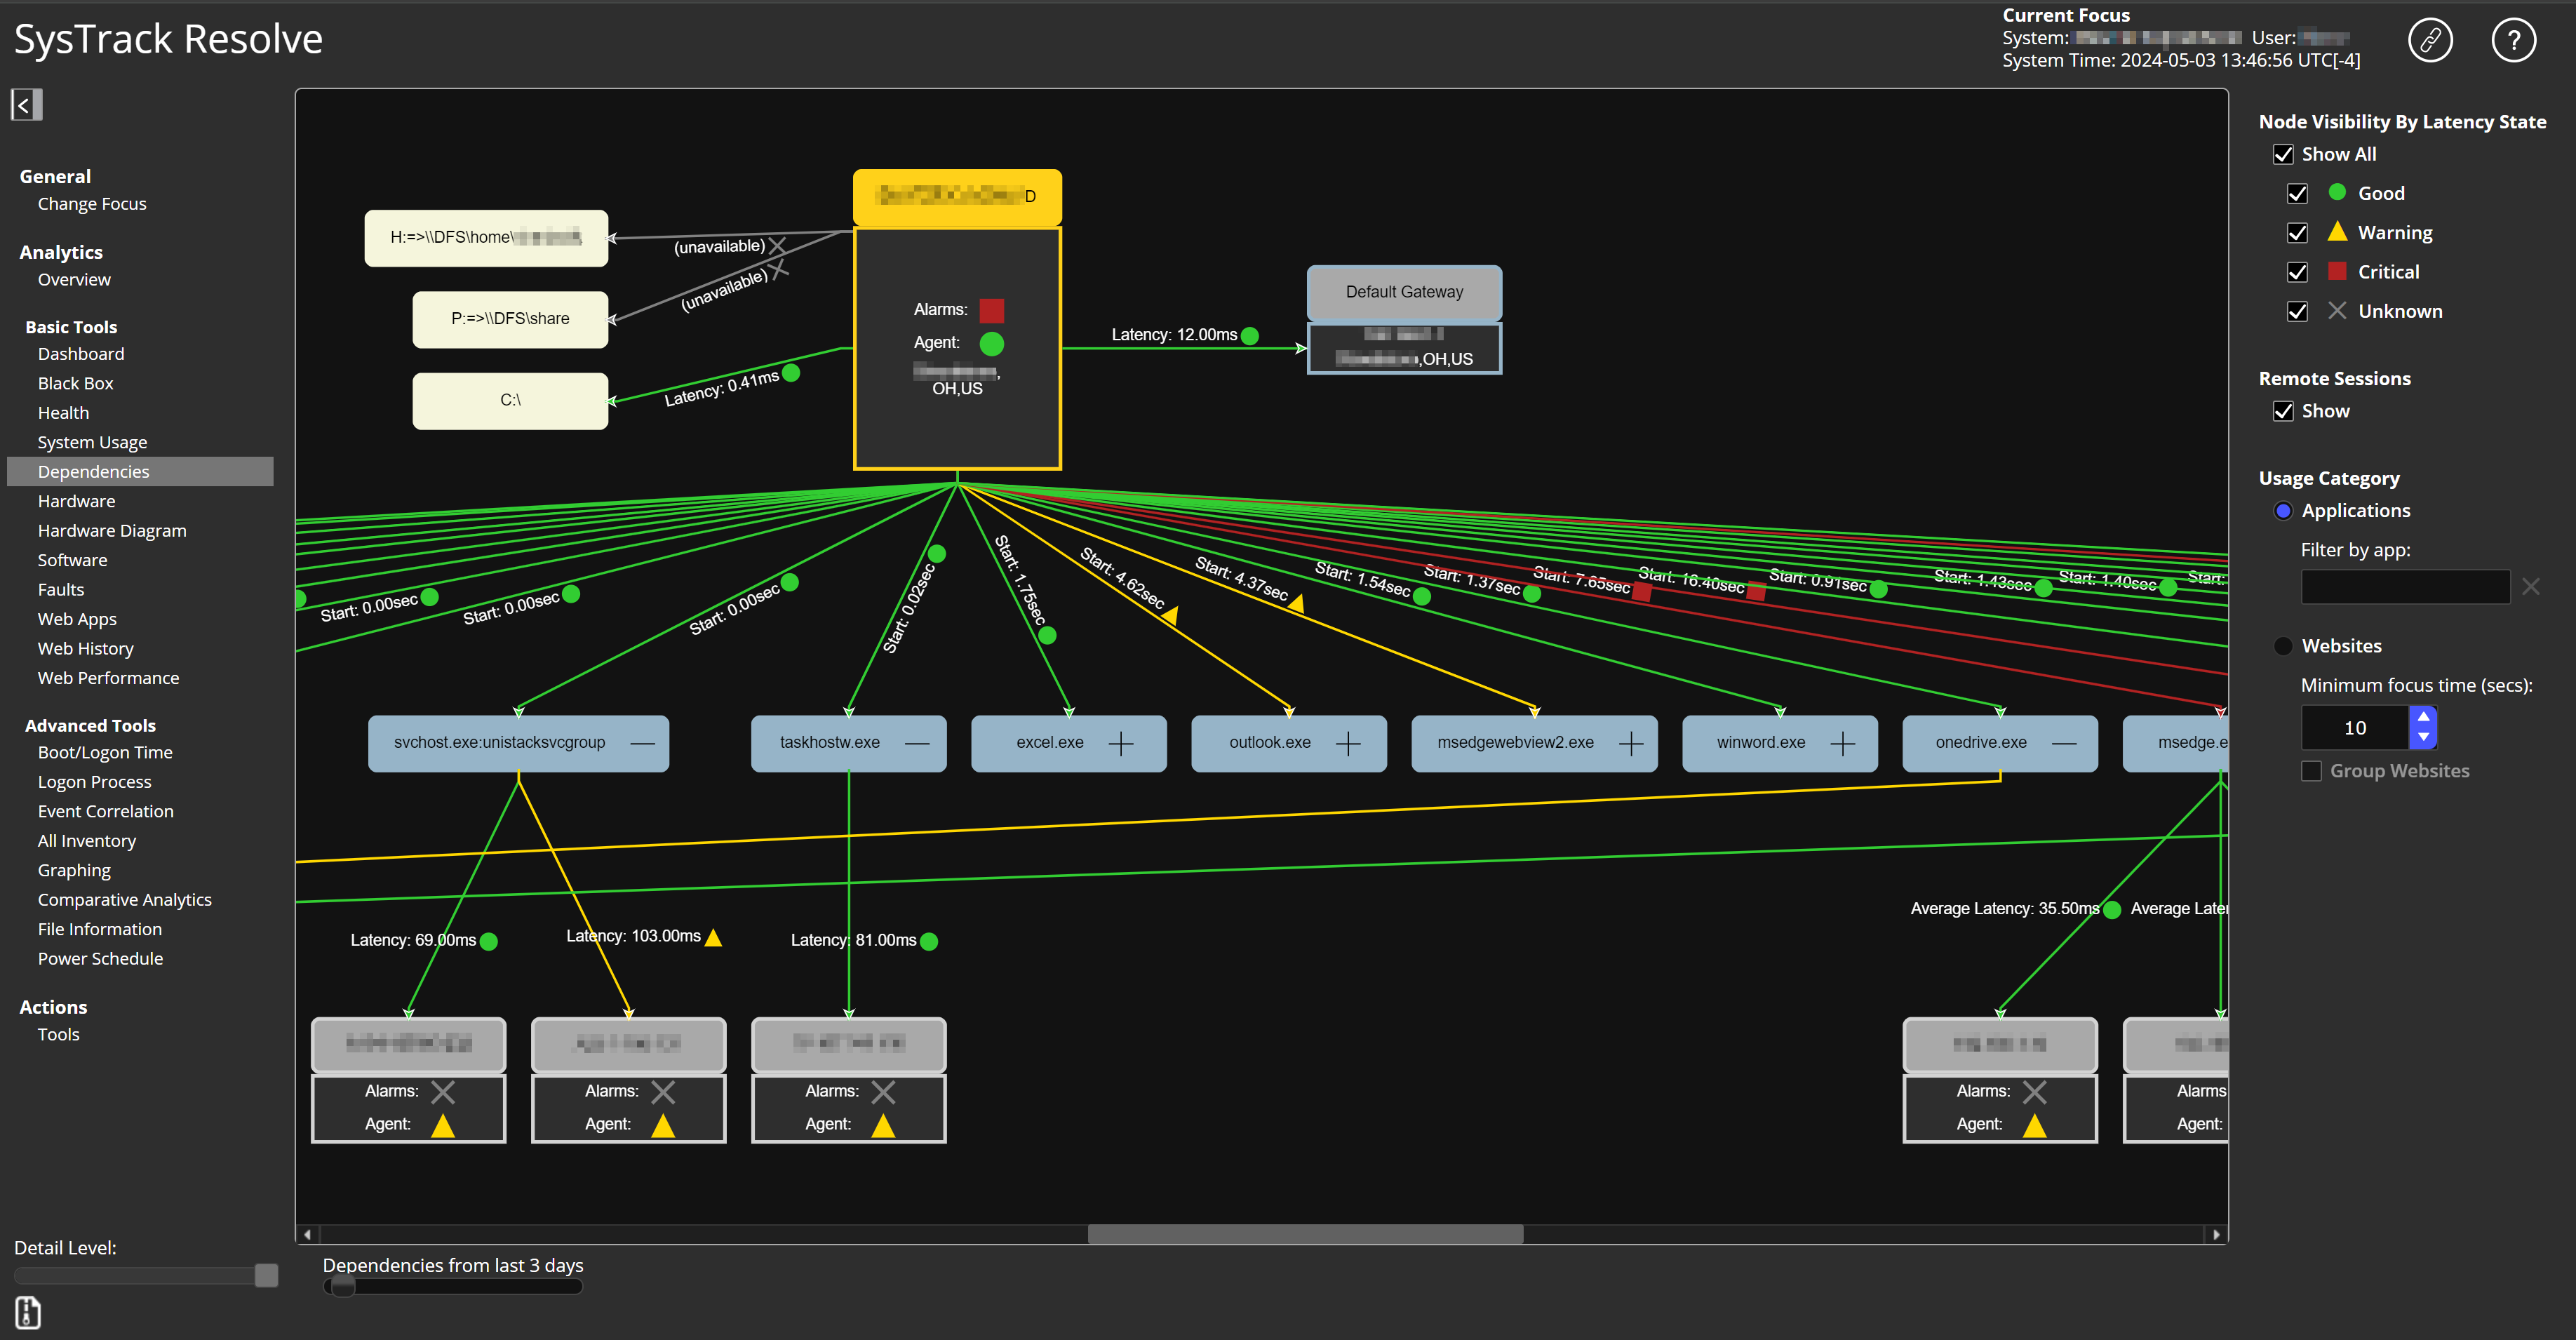
If Latency is having a high impact, you could use the Dependencies tool to continue your investigation. This tool provides a system dependency map with a history of systems used to access the targeted system, local and mapped drives, and application dependencies and network latencies.
TIP: If a dependency on the map has a red connecting line, that indicates a latency you could investigate.
-
To instead investigate why the Health Tool Disk category has a high impact, you could use the Graphing tool. This tool generates graphs for selected system data series and milestones over a specified time period.
In the Graphing tool, multiple graphs are overlaid, so that you can easily view and compare related concerns. Add relevant data series to the graph such as % Disk Time, Disk Queue Length, or Disk Transfer Time. (%Total CPU displays on the graph by default.) These are metrics that could cause slow performance, especially for a virtual machine.
If you see % Total CPU and Disk Queue Length extreme peaks on the graph, these warrant further investigation. Hover over data points to see relevant information. You could note the time when the peaks occurred, and you could use the Black Box tool or the Event Correlation tool to continue the investigation.
-
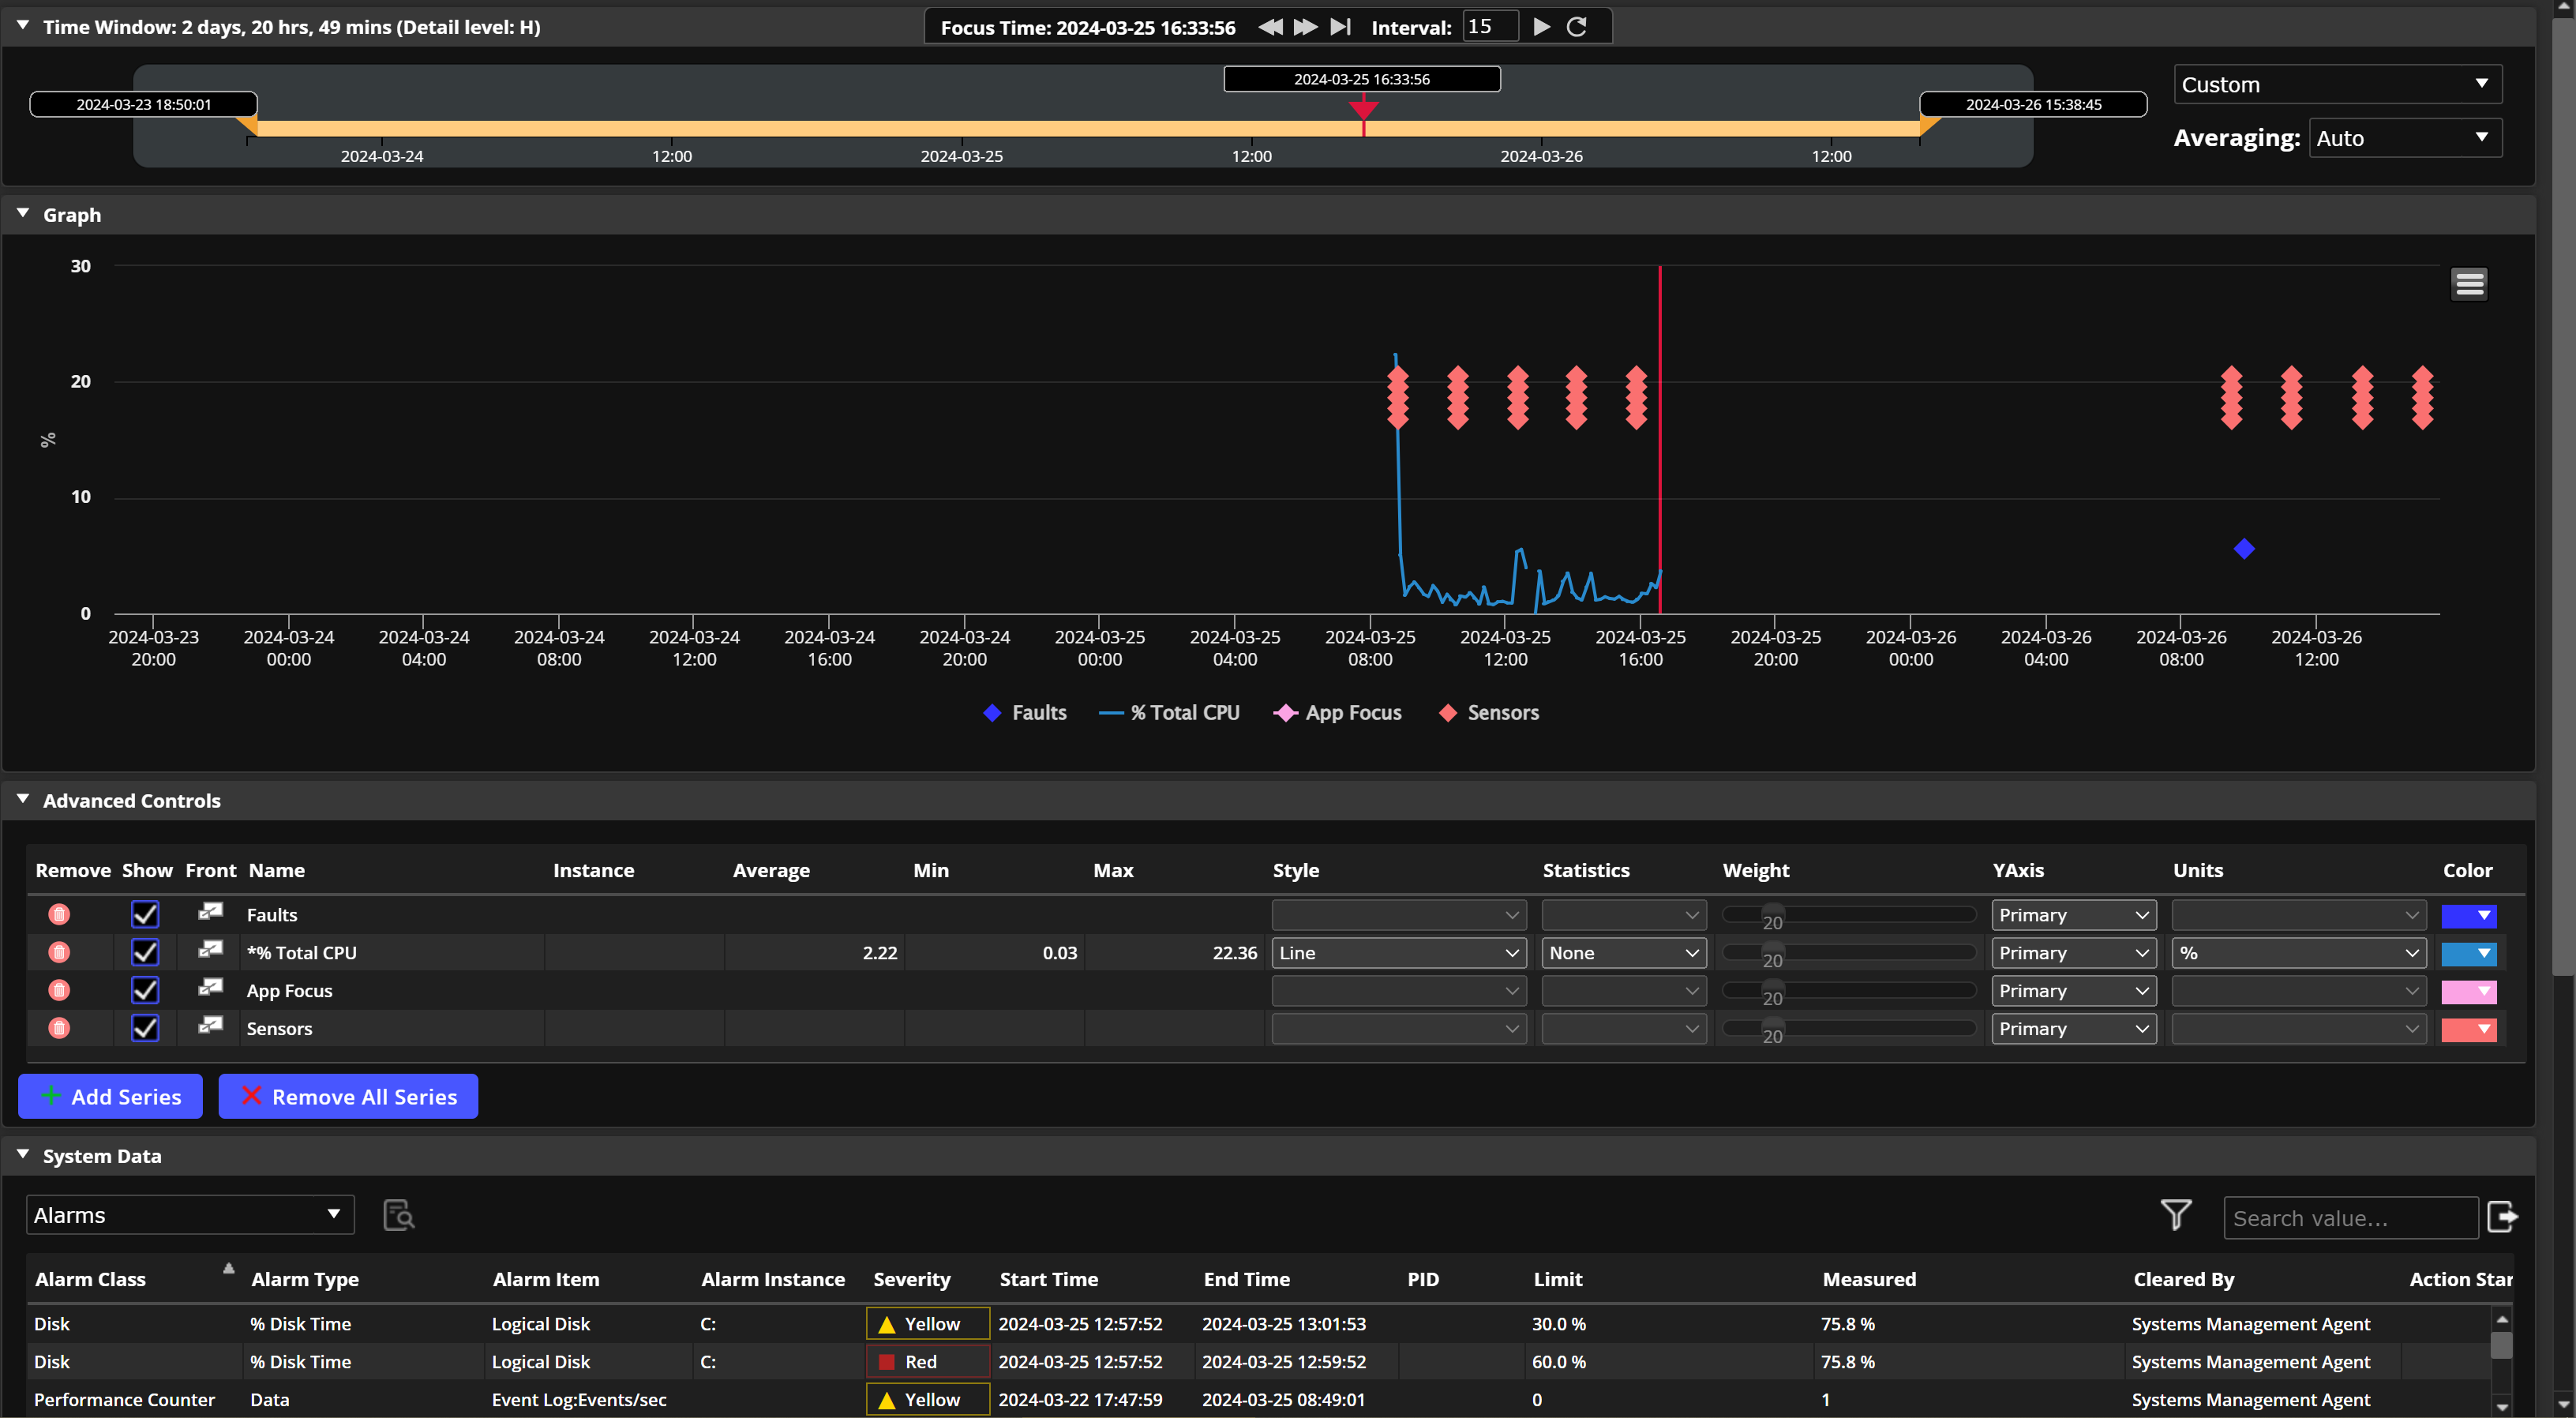
You can perform further analysis with the Black Box tool.
This tool enables you to review detailed system data for a specific point in time (the Focus Time). For example, you could set the Focus Time to the particular point where multiple sensors display. Hover over a sensor to see relevant details.
-
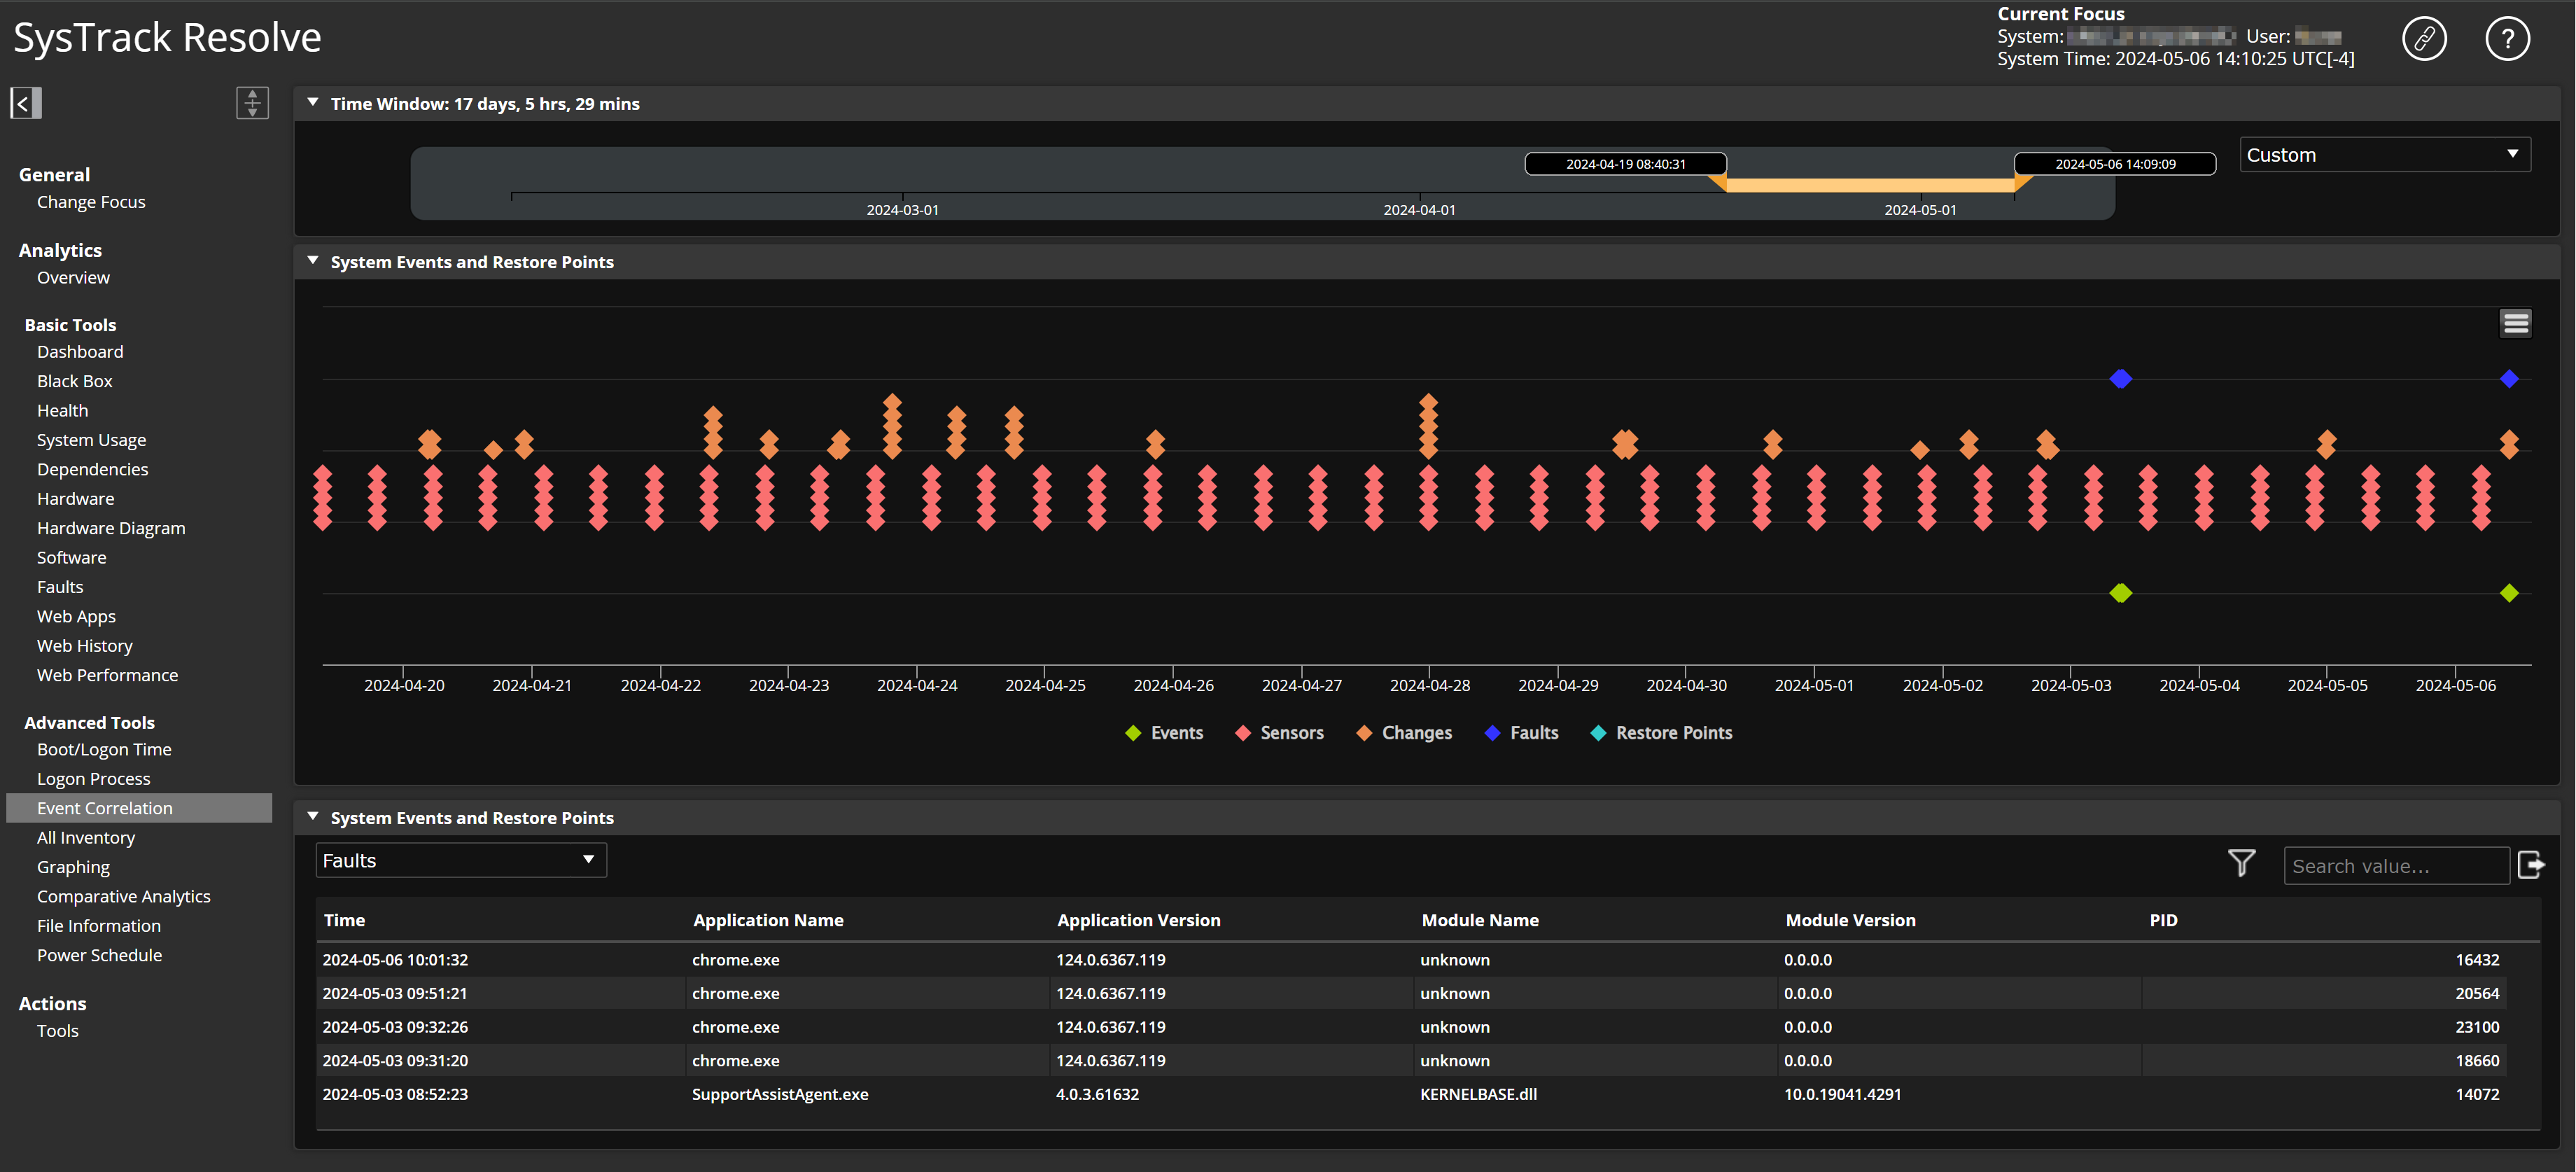
The Event Correlation tool is also useful for your investigation.
This tool overlays fault events and system alarms with system changes that occurred during the same specified time frame. Also, this tool has an option that enables you to roll the system back to a restore point before the issues occurred.
On This Page