Build a Basic Dashboard
Dashboards are built by dragging data blocks and visualization objects from the Toolbox to the workspace, defining each object's properties, and linking them to one another. Before you begin, familiarize yourself with the Dashboard Builder workspace.
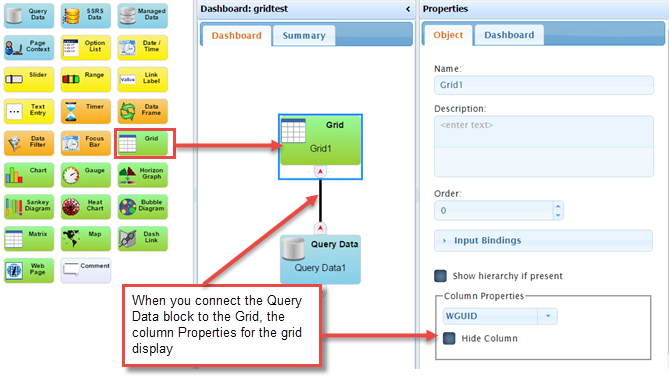
- Drag a Query Data block to the workspace and define the Query Data block as necessary. The Query Data block retrieves data based on a SQL query and makes it available to a grid or other visualization objects. If you are not completely familiar with writing SQL queries, you can use Query Builder to build a query to access SysTrack data. You can also reuse your Natural Language Queries.
-
Drag a visualization object block to the workspace (for example, a grid, gauge etc).
- Connect the Query Data Block to the visualization object (grid, gauge, chart, etc) to supply data input to the visualization object.

- Open the Input Bindings section, and if necessary select an input. The Input Bindings section may be populated automatically if there is only one possible input for the type of object being linked.
- Set the Properties for the visualization object on the Object tab (such as the Column Properties in the example above).
- Optionally, supply an Order for where on the Dashboard you want the grid to display.
NOTE: The SysTrack Dashboard Viewer allows you to move most objects and save the layout, but the Order parameter places the objects initially.
- Optionally, rename the visualization object block in the Name field, and provide a Description. The name will appear in the visualization object's title bar when the dashboard is viewed.
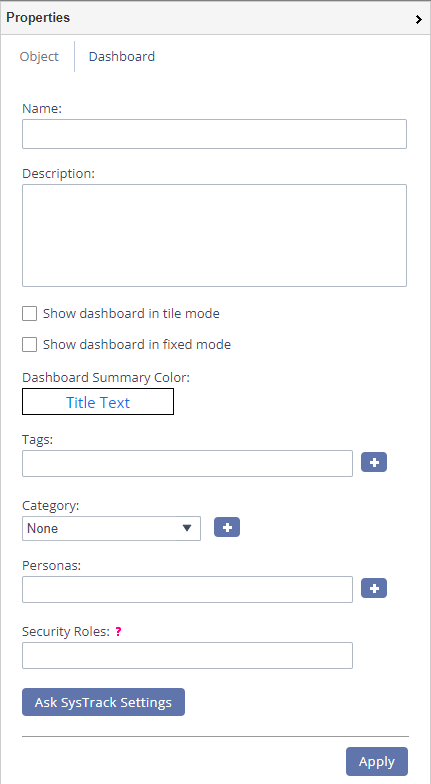
- Click the Apply button on the Dashboard tab to save your changes.
NOTE: Changes made on the Dashboard workspace are saved automatically, but you must click the Apply button to save changes to dashboard Properties.
- Optionally, select the Dashboard tab, then add a Name and Description and select a Dashboard Summary Color. The dashboard name and description will display in any link to the dashboard, such as the Dashboard Browser. The Dashboard Summary Color will be used in the Dash Link object when it displays a link to this dashboard.
- Optionally, either select or define any search tags, categories, or personas you want to include with your dashboard.

- If you wish to restrict access to this Dashboard in the Dashboard Viewer select a security role (group or user) from the drop-down list in the Security Roles field. Leave this field blank if you wish all Dashboard Viewer users to have access to your dashboard. (See Managing and Assigning Security Roles to Dashboards for more information).
- Preview your dashboard to see how it displays in the Dashboard Viewer.
On This Page