Define a Chart
A chart displays data from a Query Data block in standard visualization formats such as line, column, bar, area, pie, scatter, or spline.
Creating a chart involves three steps:
-
Add a Chart block and configure its general settings.
-
Add and configure series.
-
Configure axis labels and limits.
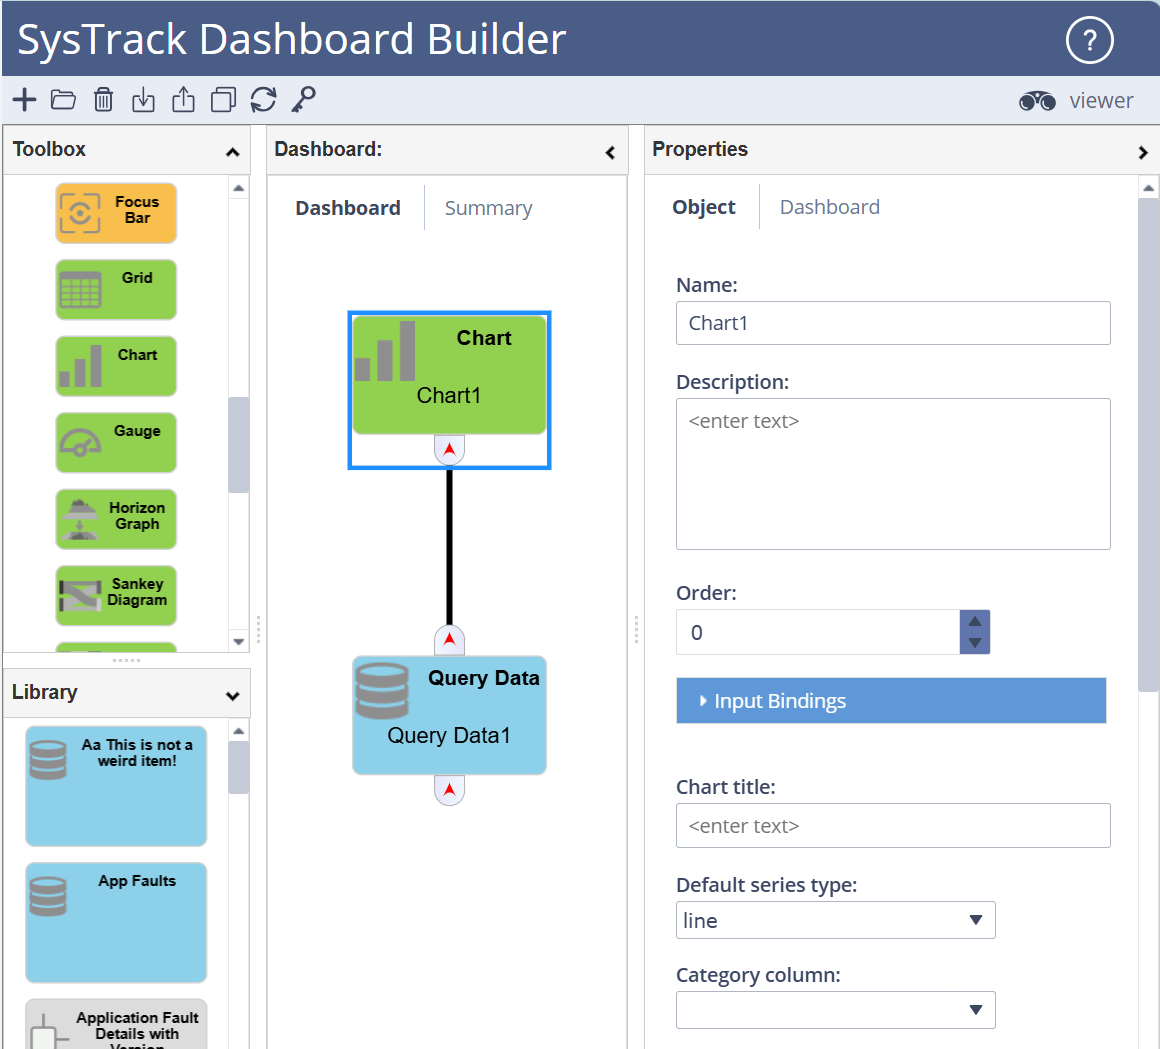
Add a Chart to a Dashboard
-
In Dashboard Builder, drag a Query Data block to the workspace and configure the block as needed.
-
Drag a Chart block from the Toolbox onto the workspace.
-
Connect the output port of the Query Data block to the input port of the Chart block.
-
Enter a name and description for the chart. The name appears in the chart pane title when the dashboard is viewed.
-
Enter an Order value to define where the chart appears on the dashboard.
-
Enter the Chart title.
-
From Default series type, select the default chart series type. See Available Chart Series Types for details.
-
From the Category column list, select the data column that the chart will use. The available columns come from the SQL query defined in the Query Data block.
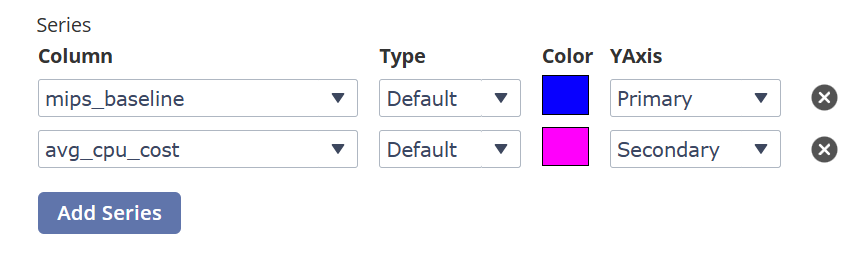
Configure Chart Series
NOTE: If you do not manually add series, the system creates one series for every numeric column.
For each series you want to display:
-
In Column, select the data source for the series.
-
In Type, select a series type if different from the default.
-
Select a Color if needed. If you do not select a color, the system assigns one automatically.
-
In YAxis, select Primary or Secondary. Use two Y-axes if your series values differ significantly in scale.
-
To create additional series, click Add Series and repeat the steps above.
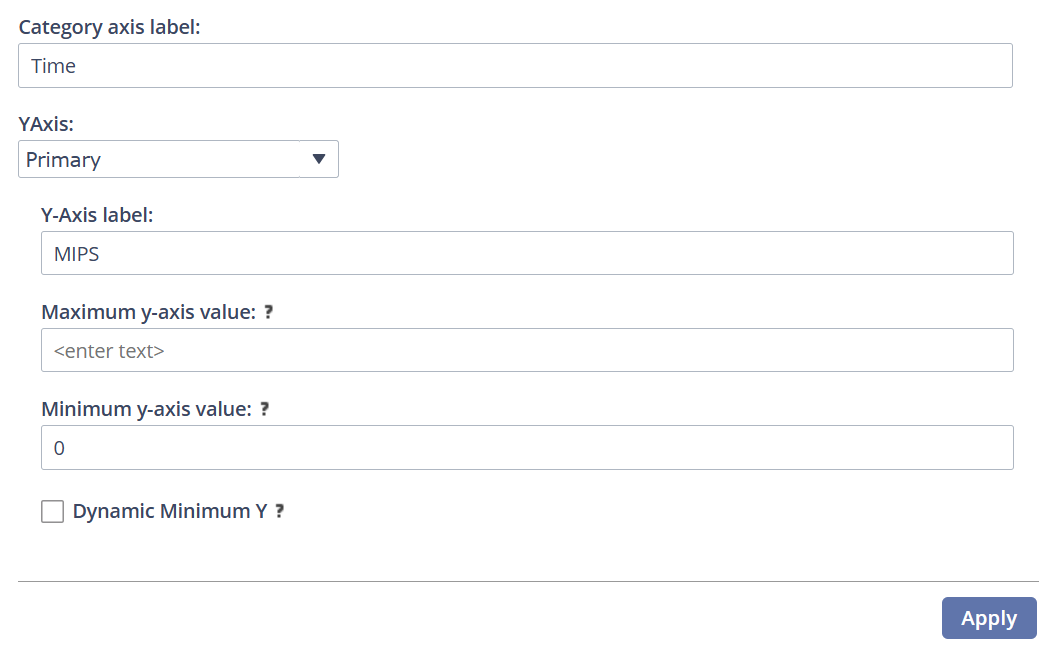
Configure Axis Labels and Limits
-
Enter a label for the category axis.
-
Configure the primary Y-Axis:
-
In YAxis, select Primary.
-
Enter a Y-axis label.
-
(Optional) Enter maximum and minimum values. If you leave these fields empty, the axis auto-scales based on the data. Auto-scaling starts at 0 unless the data includes negative values.
-
To allow the Y-axis to fit the data without starting at zero, select Dynamic Minimum Y.
-
-
Configure the secondary Y-Axis: In YAxis, select Secondary and configure it using the same steps as the primary axis.
-
Click Apply to save your changes.
For instructions on adding drill-down actions for chart series, see Defining Drill-downs.
On This Page