Home >
Define a Bubble Diagram
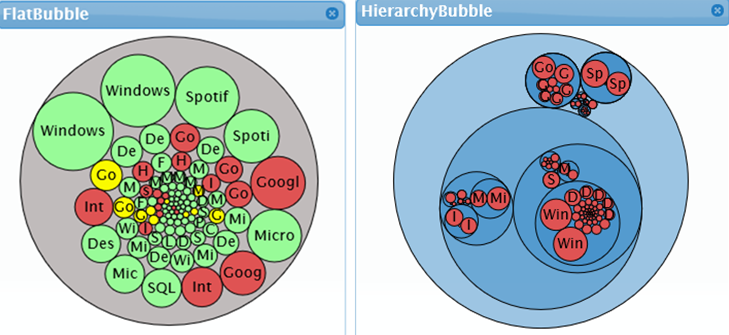
A Bubble Diagram displays items using bubble size and color to represent two values, for example file sizes, the number of hits on various website, or the active time for application usage as shown in the examples below.
You can also use Bubble Diagrams to:
- Clearly show the relative relationships between data values
- Display hierarchies if the data block is configured for it. Hierarchies display as bubbles within bubbles. If the data is hierarchically ordered, the Bubble Diagram can also show the parent/child relationships, such as applications that make up a package.
- Show two dimensions of data simultaneously by tying the size and color of the bubble to input data - for example memory usage of an application driving the size of the bubble, and CPU usage driving the color. To control the thresholds and colors used to color the bubbles you can set up and attach a Range Control to the Bubble Diagram to set the ranges and colors.

- Drag a Query Data block to the workspace and define the Query Data block as necessary.
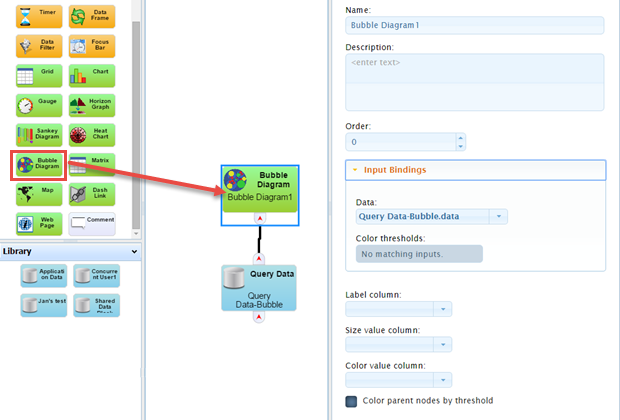
- Drag the Bubble Diagram block from the Toolbox into the workspace.
- Link the Query Data block with the Bubble Diagram block by connecting the Query Data block’s output port to the Bubble Diagram block’s input port.
- Optionally, Name the Bubble Diagram and provide a Description. The name will appear in the Bubble Diagram pane’s title bar when the dashboard is viewed.
- Optionally, supply an Order for where on the Dashboard you want the Bubble Diagram to display.
NOTE: The SysTrack Dashboard Viewer allows you to move most objects and save the layout, but the Order parameter places the objects initially.
- Open the Input Bindings section, and select an input from the Data drop-down list.

- Select a data type from the Label column field's drop-down list to display as labels on the bubbles in the diagram.
- Select a value from the Size value column field's drop-down list with which to drive the bubble size.
- Select a value from the Color value column field's drop-down list with which to drive the bubble's color.
- Optionally, you can choose to attach and set up a Range Slider block to control color thresholds, see Defining a Range Control for more information. After setting up a Range Slider block, select the Bubble Diagram block, and optionally, select Color parent nodes by threshold.
- If you wish to set up a Hierarchical bubble diagram, see Setting up a Hierarchy for more information.
- When you are done, click the Apply button to save your changes.
On This Page