Comparative Analytics Tool
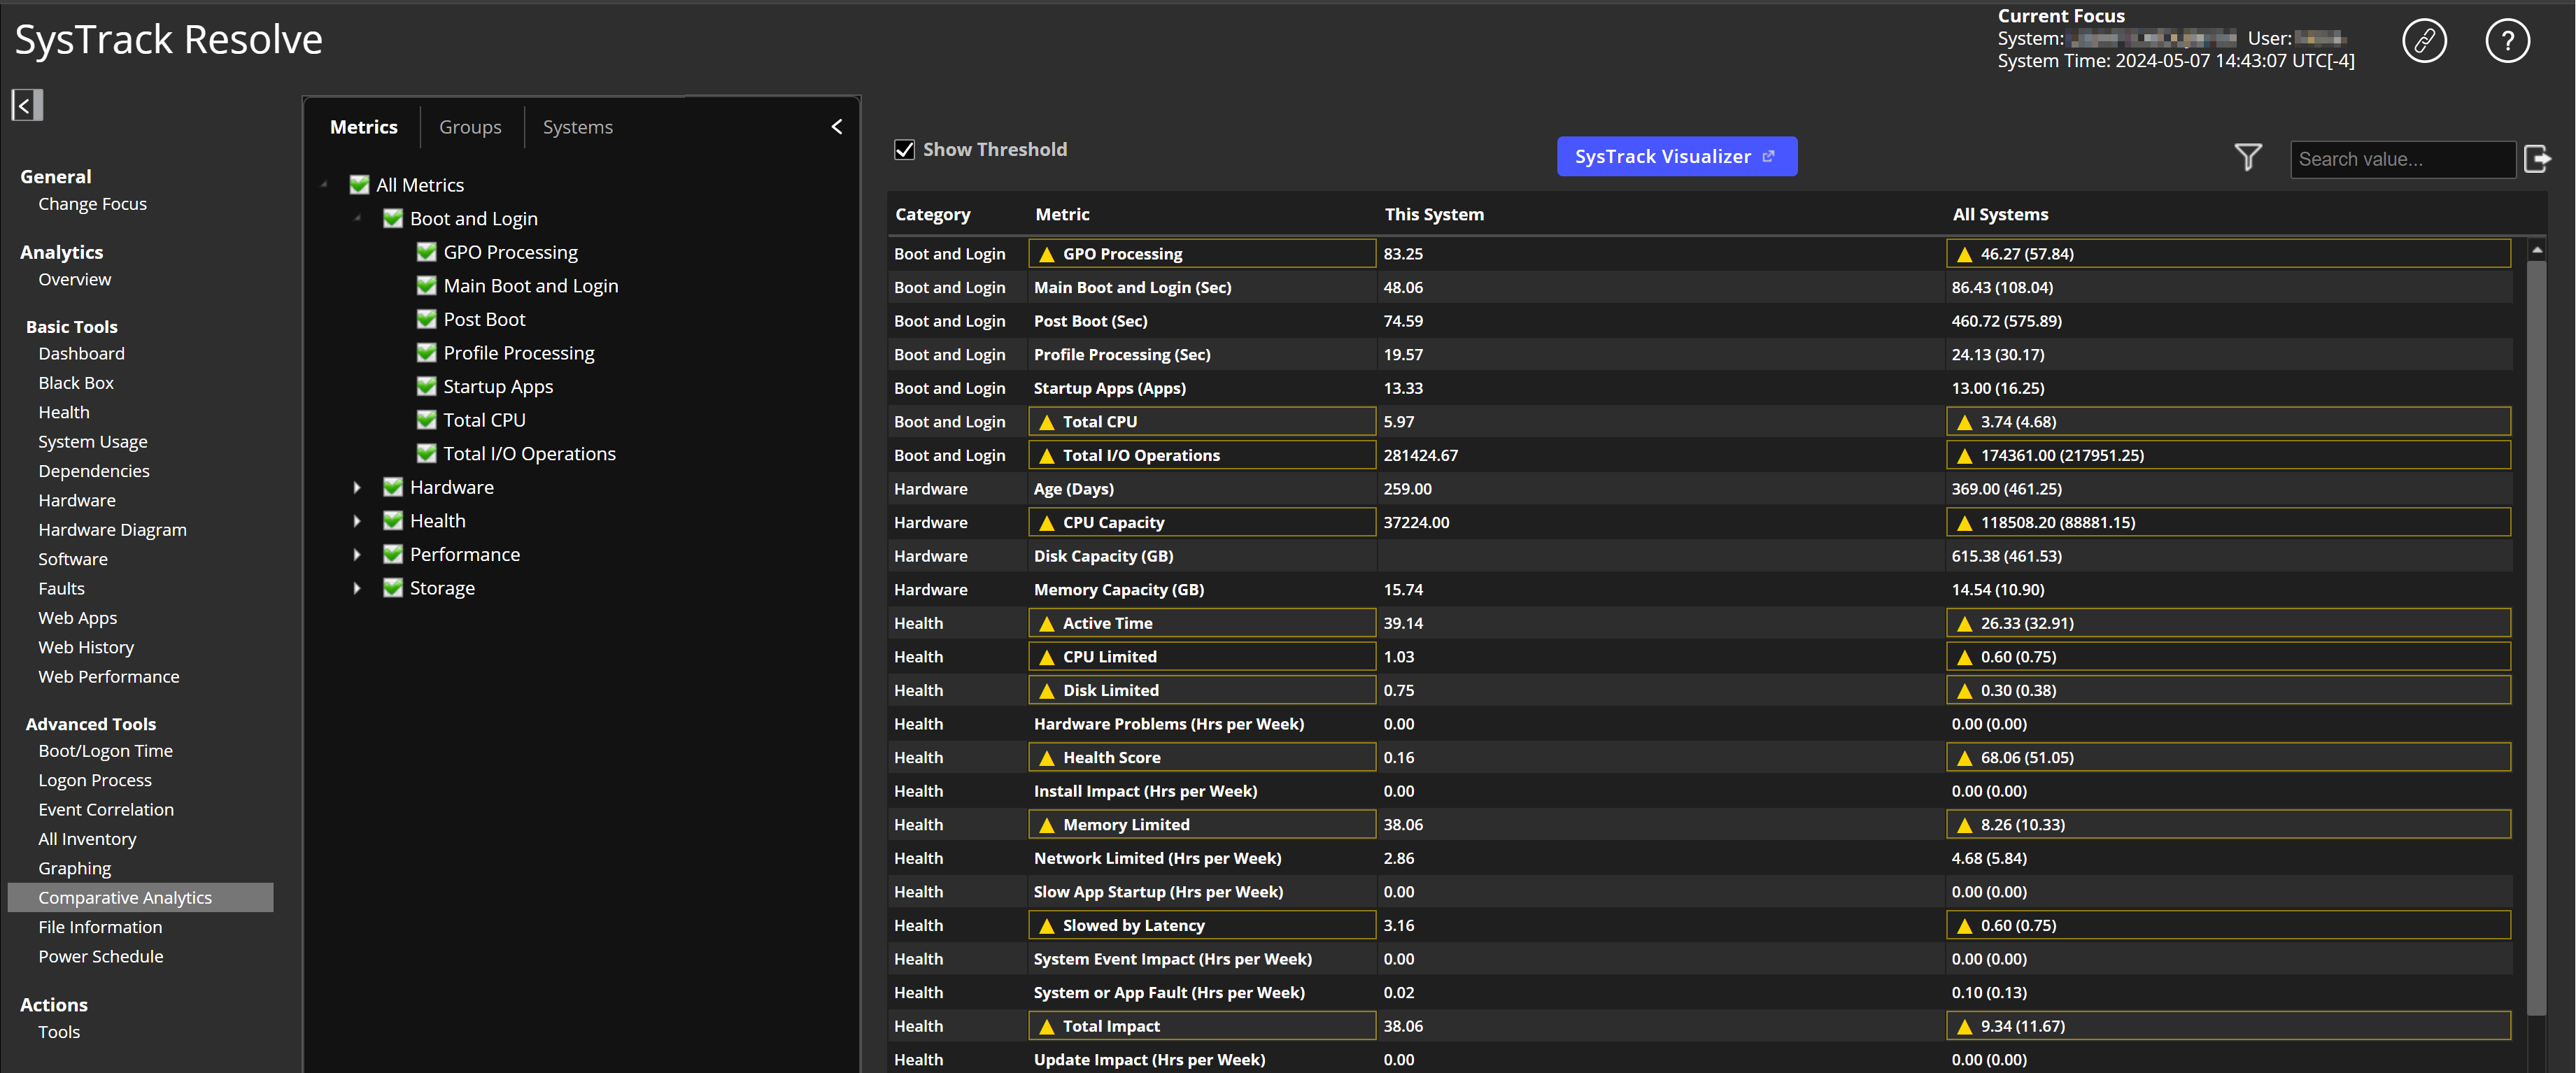
Resolve's Comparative Analytics tool enables you to compare selected metrics from the focus system to the metrics of one or more groups of systems.
You have the option to display the threshold values for each group's metrics. Threshold values are based on average consumption, and they appear in parentheses. They are calculated by averaging the values collected from all systems in the group and then adding the standard deviation.
Yellow triangle symbols highlight potential issues with the focus system's metric values. For some metrics, such as Total I/O Operations, you might have an issue if a system has a metric value above one or more of the selected group's threshold values. In this case, the yellow triangle will appear next to the Metric name and next to the group values that the focus system's metric value falls above.
For other metrics, such as Memory Capacity, you might have an issue if a system has a metric value below one or more of the selected group's threshold values. In this case, the yellow triangle will appear next to the Metric name and next to the group values that the focus system's metric value falls below.
Before you decide whether there is an issue, you need to consider the metric value's context. For example, if a system has a User Files value that is above a selected group's threshold value, but the focus system has a much larger than average amount of storage space available, this is probably not an issue.
Follow these steps to use the Comparative Analytics tool:
-
To get started with this tool, select a focus user for the data that displays on this page, and then proceed with the following steps.
-
Select the Metrics tab, and check or uncheck the boxes for the metrics that you want to include or exclude.
NOTE: Any selections you make (metrics, group, and threshold display state) will persist in future Resolve sessions.
- Select the Groups tab, and check or uncheck the boxes for the groups that you want to include or exclude.

-
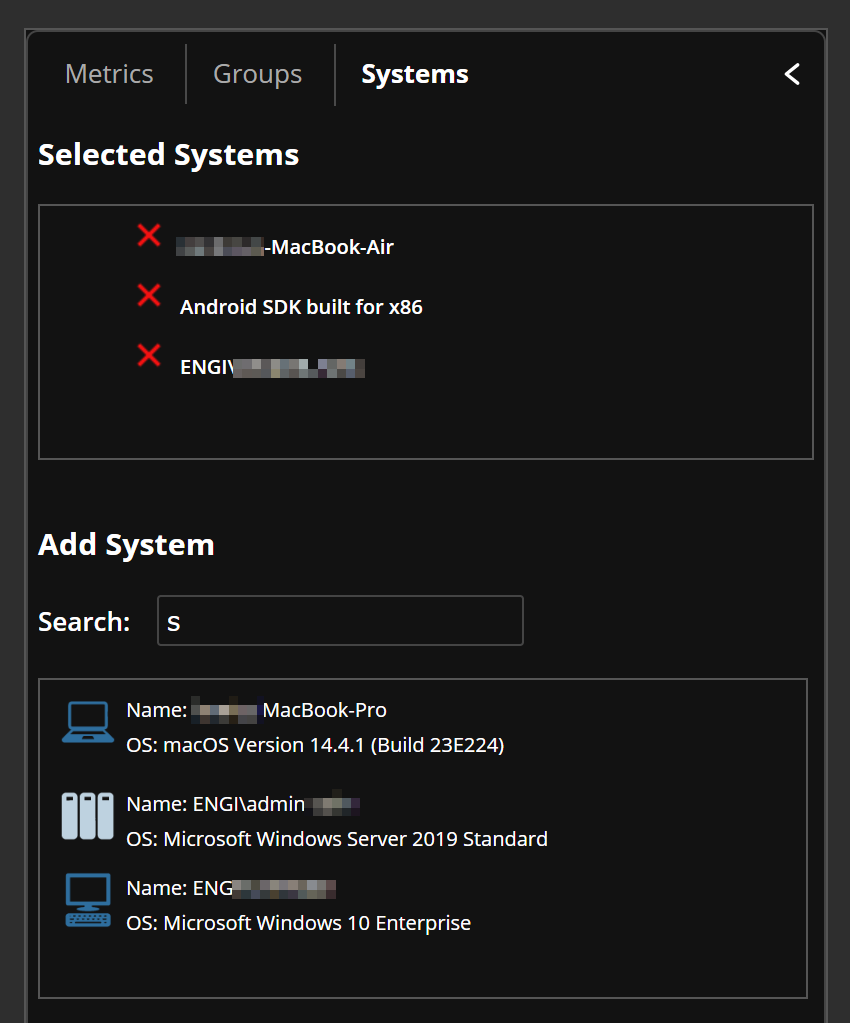
If you want to add systems to the comparison, select the Systems tab, use the Search field to find systems, and double-click the systems you want to add to the Selected Systems list.
-
If you want to add threshold values to the selected group metrics, check the Show Threshold check box (near the top of the page). This makes the threshold values appear in parentheses next to the items in the table below the check box.
On This Page