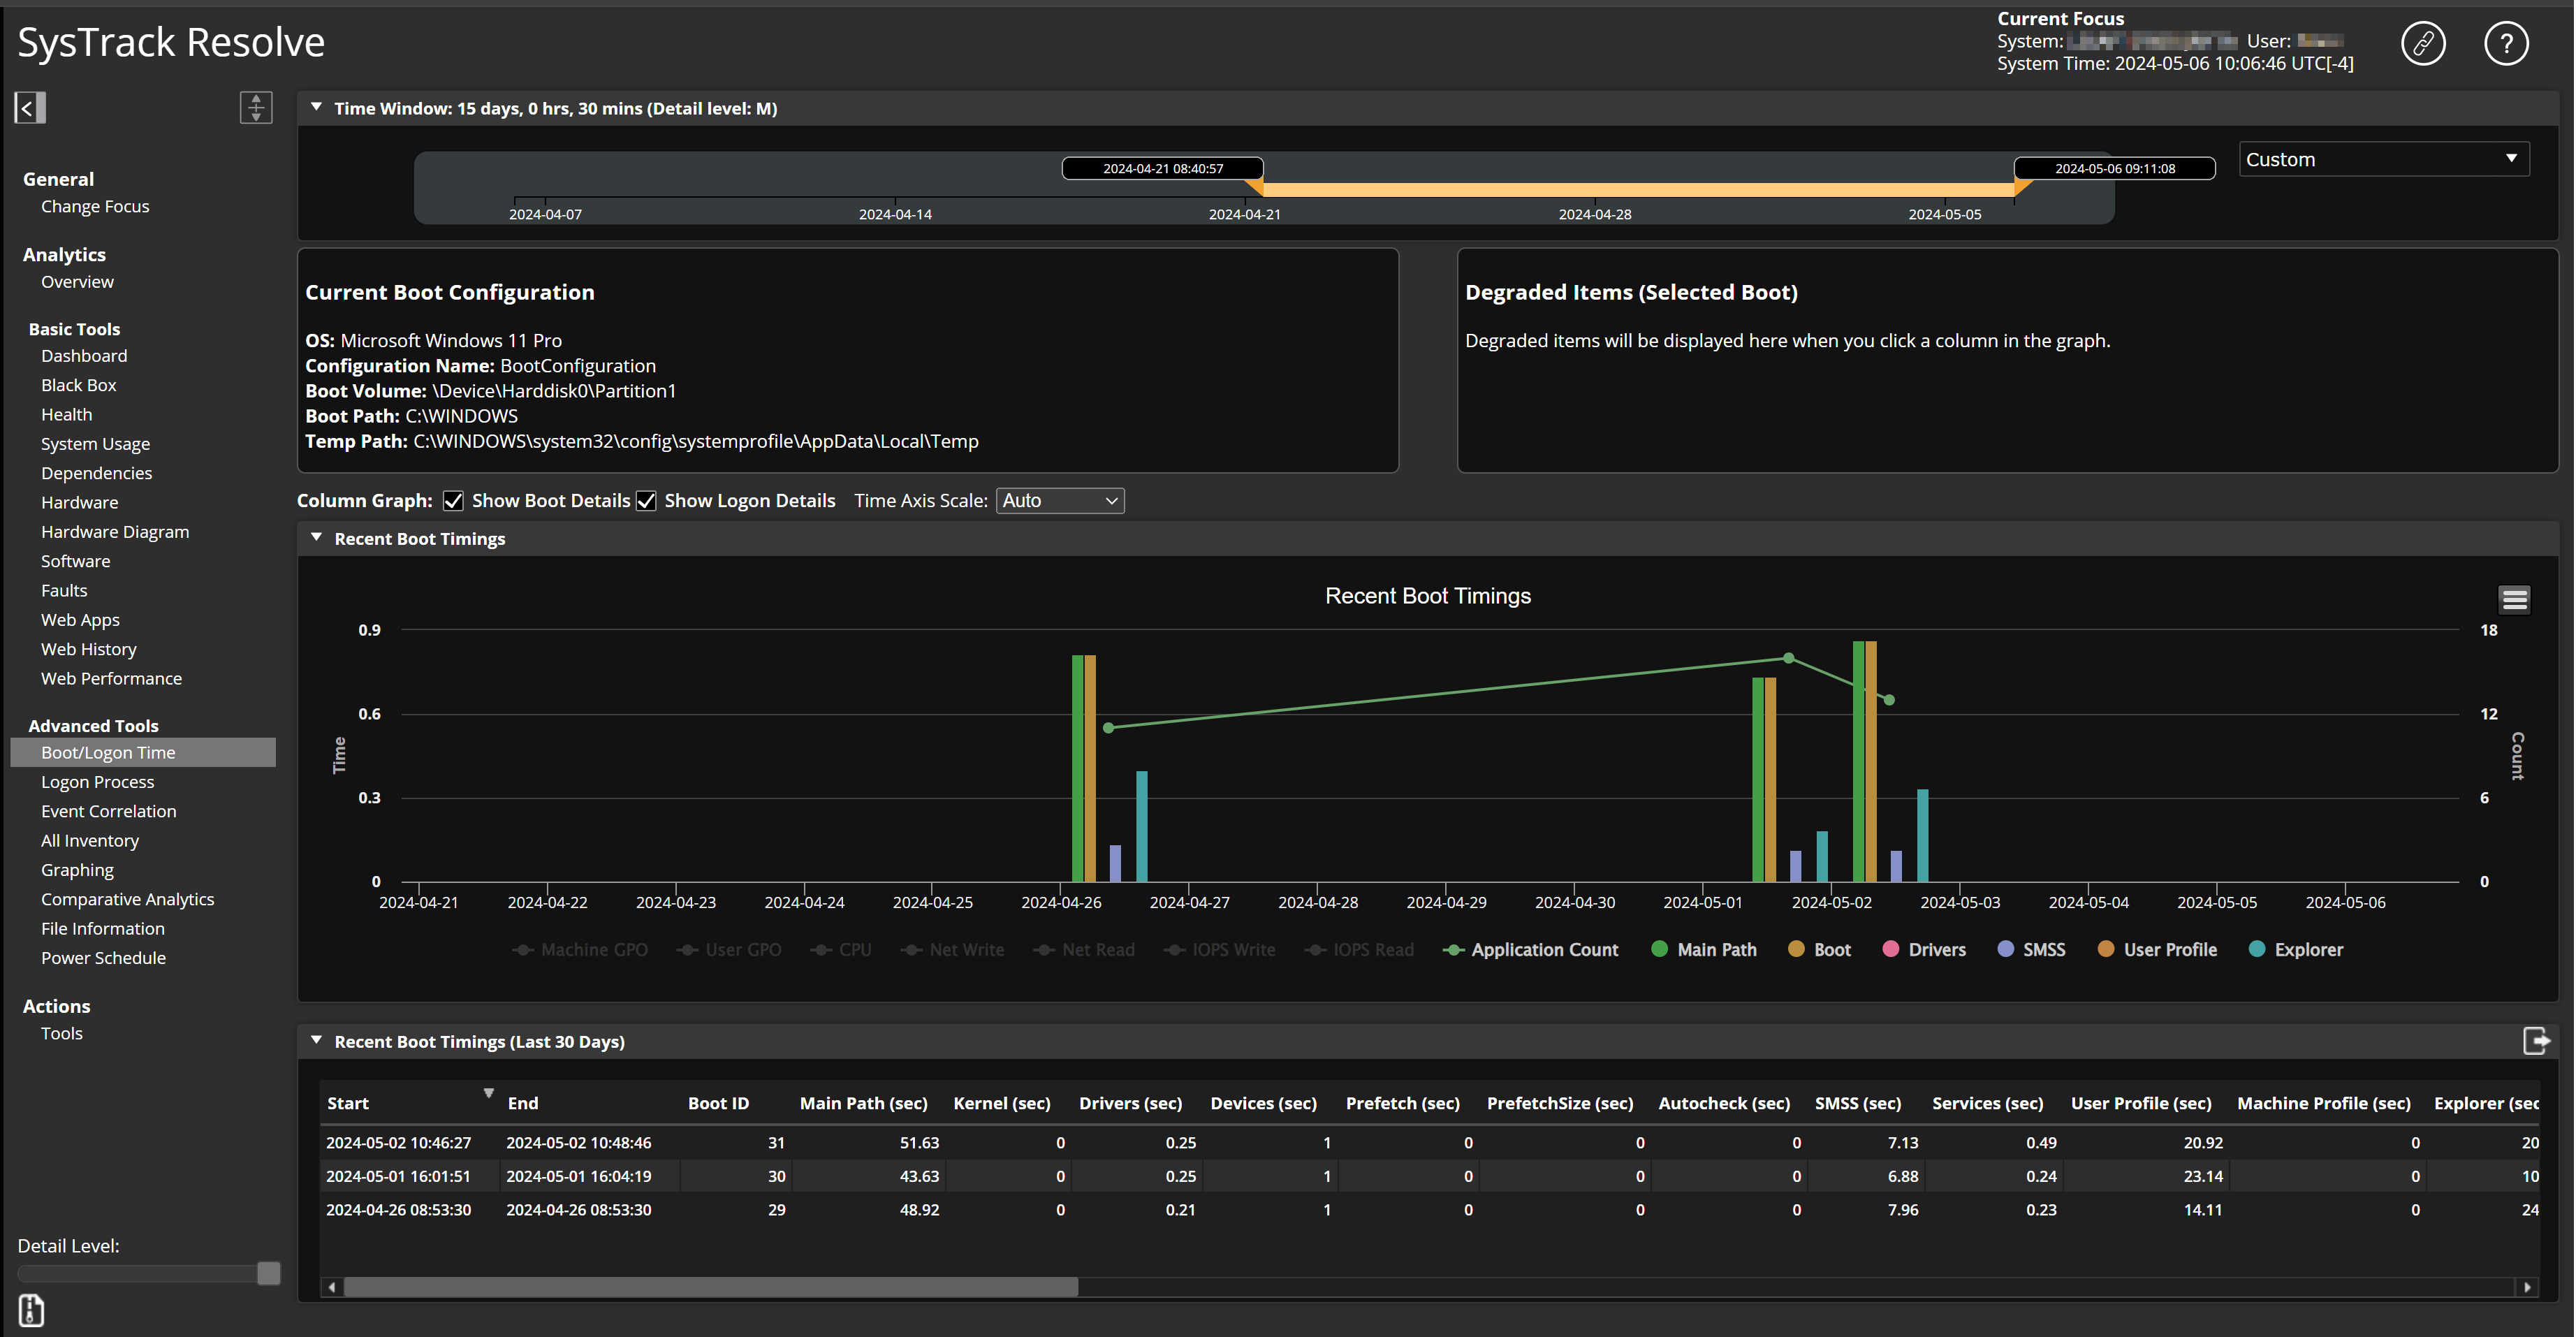
Boot/Logon Time Tool
Resolve's Boot/Logon Time tool provides boot and logon data for the selected focus system for the past 30 days. This tool's data helps you determine whether any specific issues are causing slower boot times. The tool's graph gives you a map of boot times for system login processes so that you can investigate issues.
To get started with this tool, select a focus user, configure a Time Window for the data that displays on this page, and then proceed with the following sections.
Application Hook Setting
SysTrack's Application Hook setting is important for the data collection in this tool. The Application Hook setting is applied to systems in the system's assigned Deployment Tool profile configuration. You can enable and disable the setting on the configuration's Policies and Settings tab, in the Application Management category of policies.
IMPORTANT: The Boot/Logon Time tool is not available for systems that have the Application Hook setting disabled. Application Hook allows the collection of application start data required for the Boot/Logon Time tool.
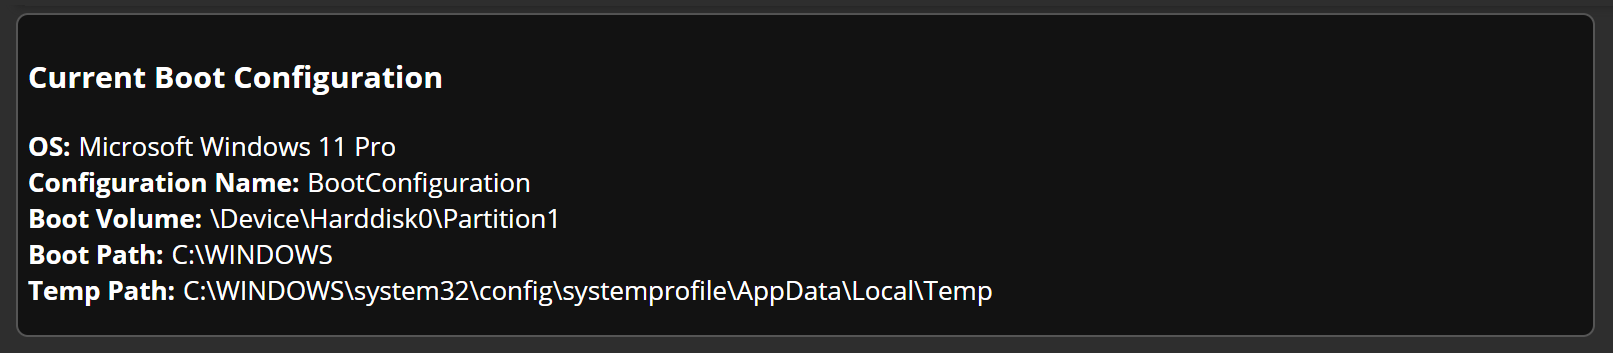
Current Boot Configuration
In the Current Boot Configuration section of the page, you see the focus system's basic boot configuration information:
-
Operating System
-
Configuration Name
-
Boot Volume
-
Boot Path
-
Temp Path
Degraded Items (Selected Boot)
The Degraded Items (Selected Boot) section of the page changes based on items you click in the Recent Boot Timings graph. Click a bar on the graph, and the Degraded Items section shows any issues that caused slower boot times during the boot up.
Recent Boot Timings Graph
The Recent Boot Timings graph gives you a easy way to see data for each system boot that happened during your selected Time Window (default of 30 days).
Check or uncheck the Show Boot Details and Show Logon Details check boxes to show or hide the graph's boot and logon data points.
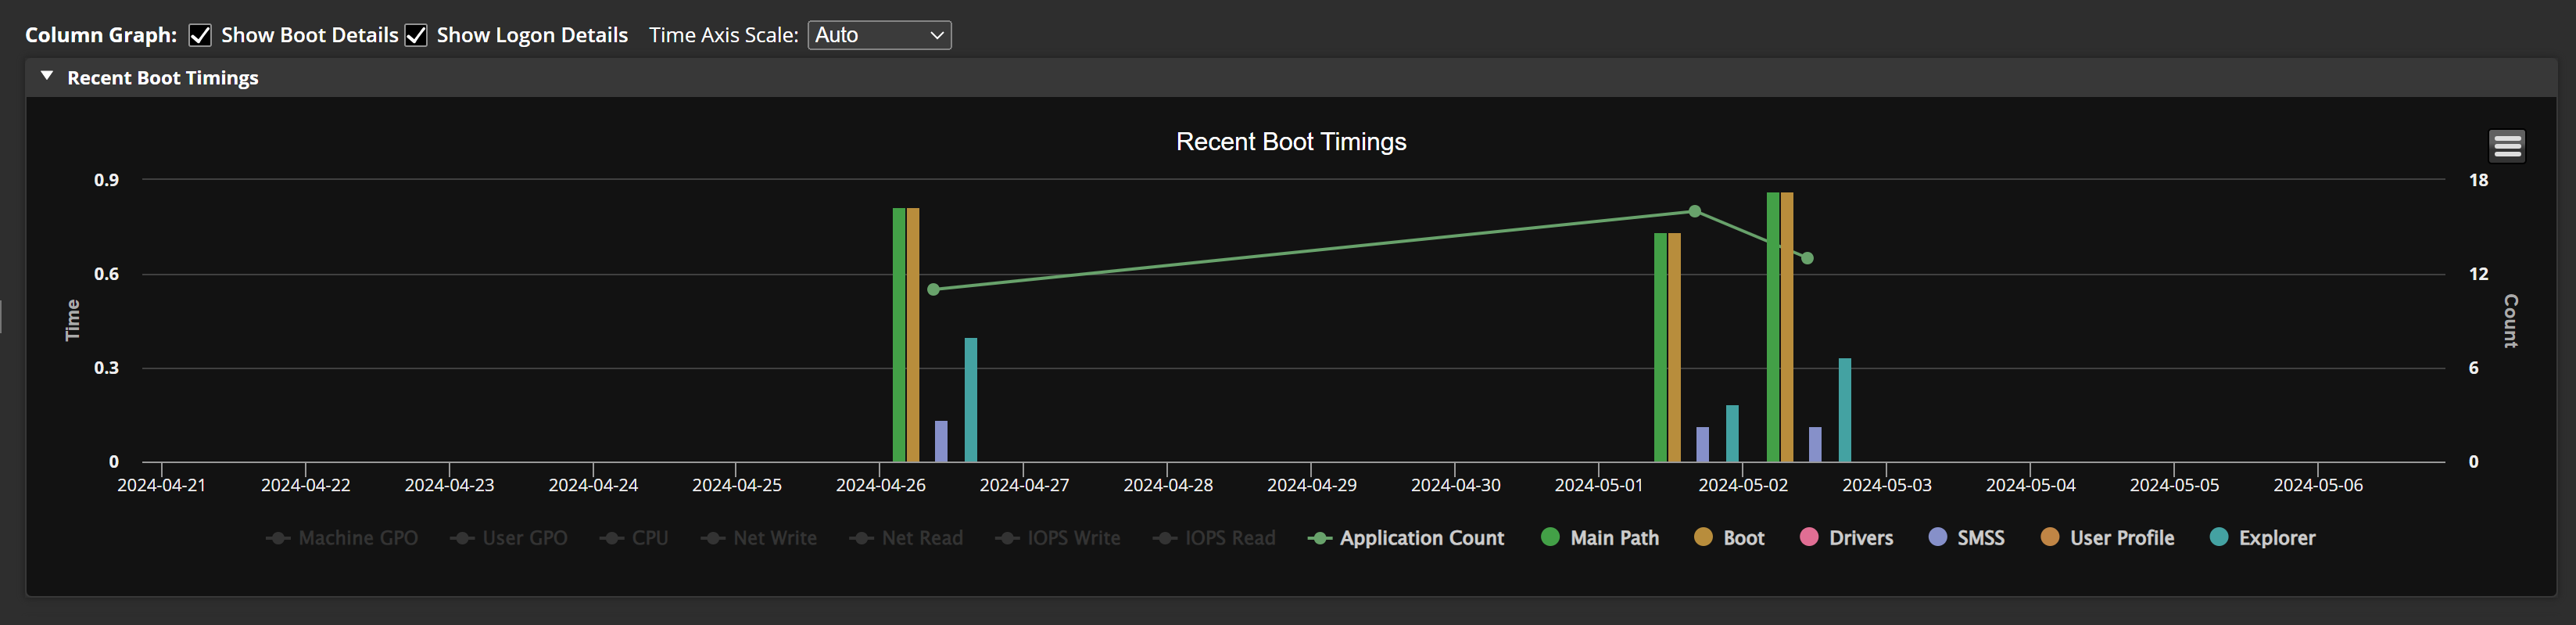
Time and Count Scales on the Graph
The Time scale on the left Y axis applies to the bars on the graph. The Count scale on the right Y axis applies to the lines on the graph. When more than one line shares the right Y axis, the scale encompasses the highest and lowest values from each line.
To change the default Time scale of Auto, select from the options in the Time Axis Scale list. The options include several increments from one second up to one hour.
Bars on the Graph
Hover over bars or lines on the graph to see more details. Hover over the bar categories below the graph (such as Main Path, Boot, Drivers, and more) to see only that category on the graph. You can click the categories to toggle whether they appear on the graph or are hidden.
Lines on the Graph
The categories for lines (such as CPU, Net Write, Net Read, and more) behave the same as the bar categories when you hover over or click them. Application Count is the default line on the graph.

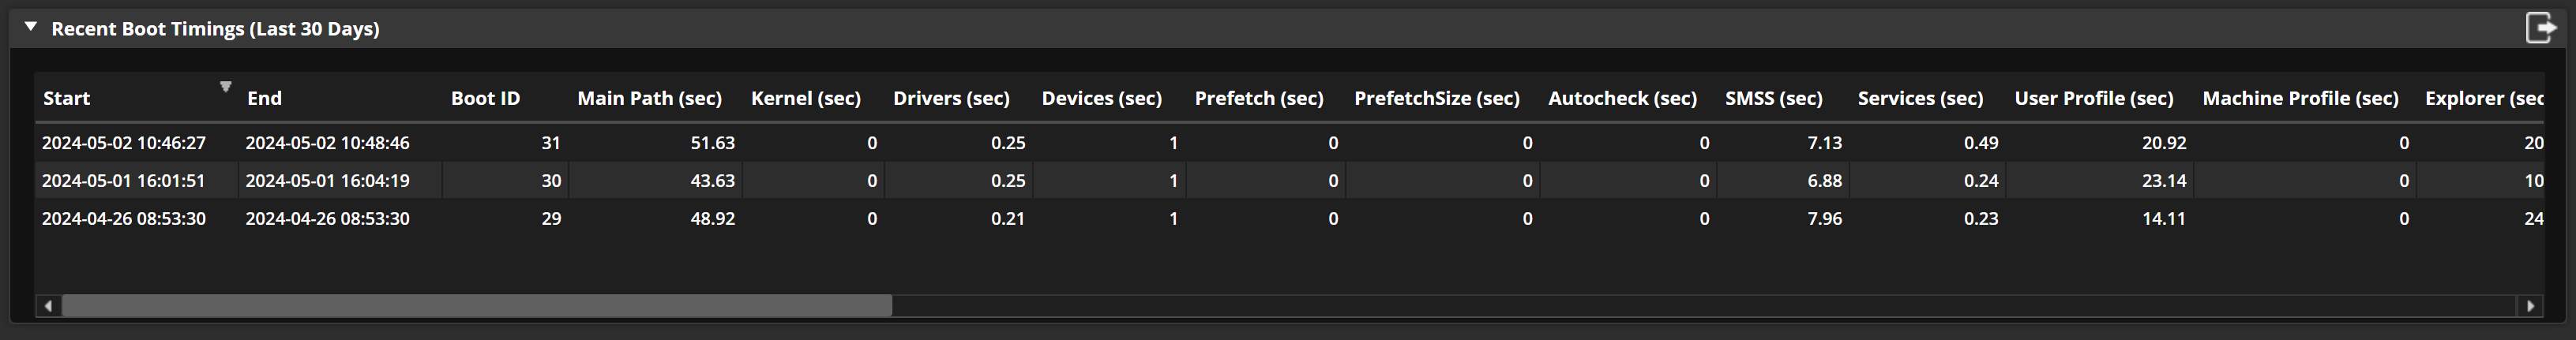
Recent Boot Timings Table
The Recent Boot Timings table at the bottom of the page displays the data from the points on the lines in the preceding graph.
On This Page