Faults Tool
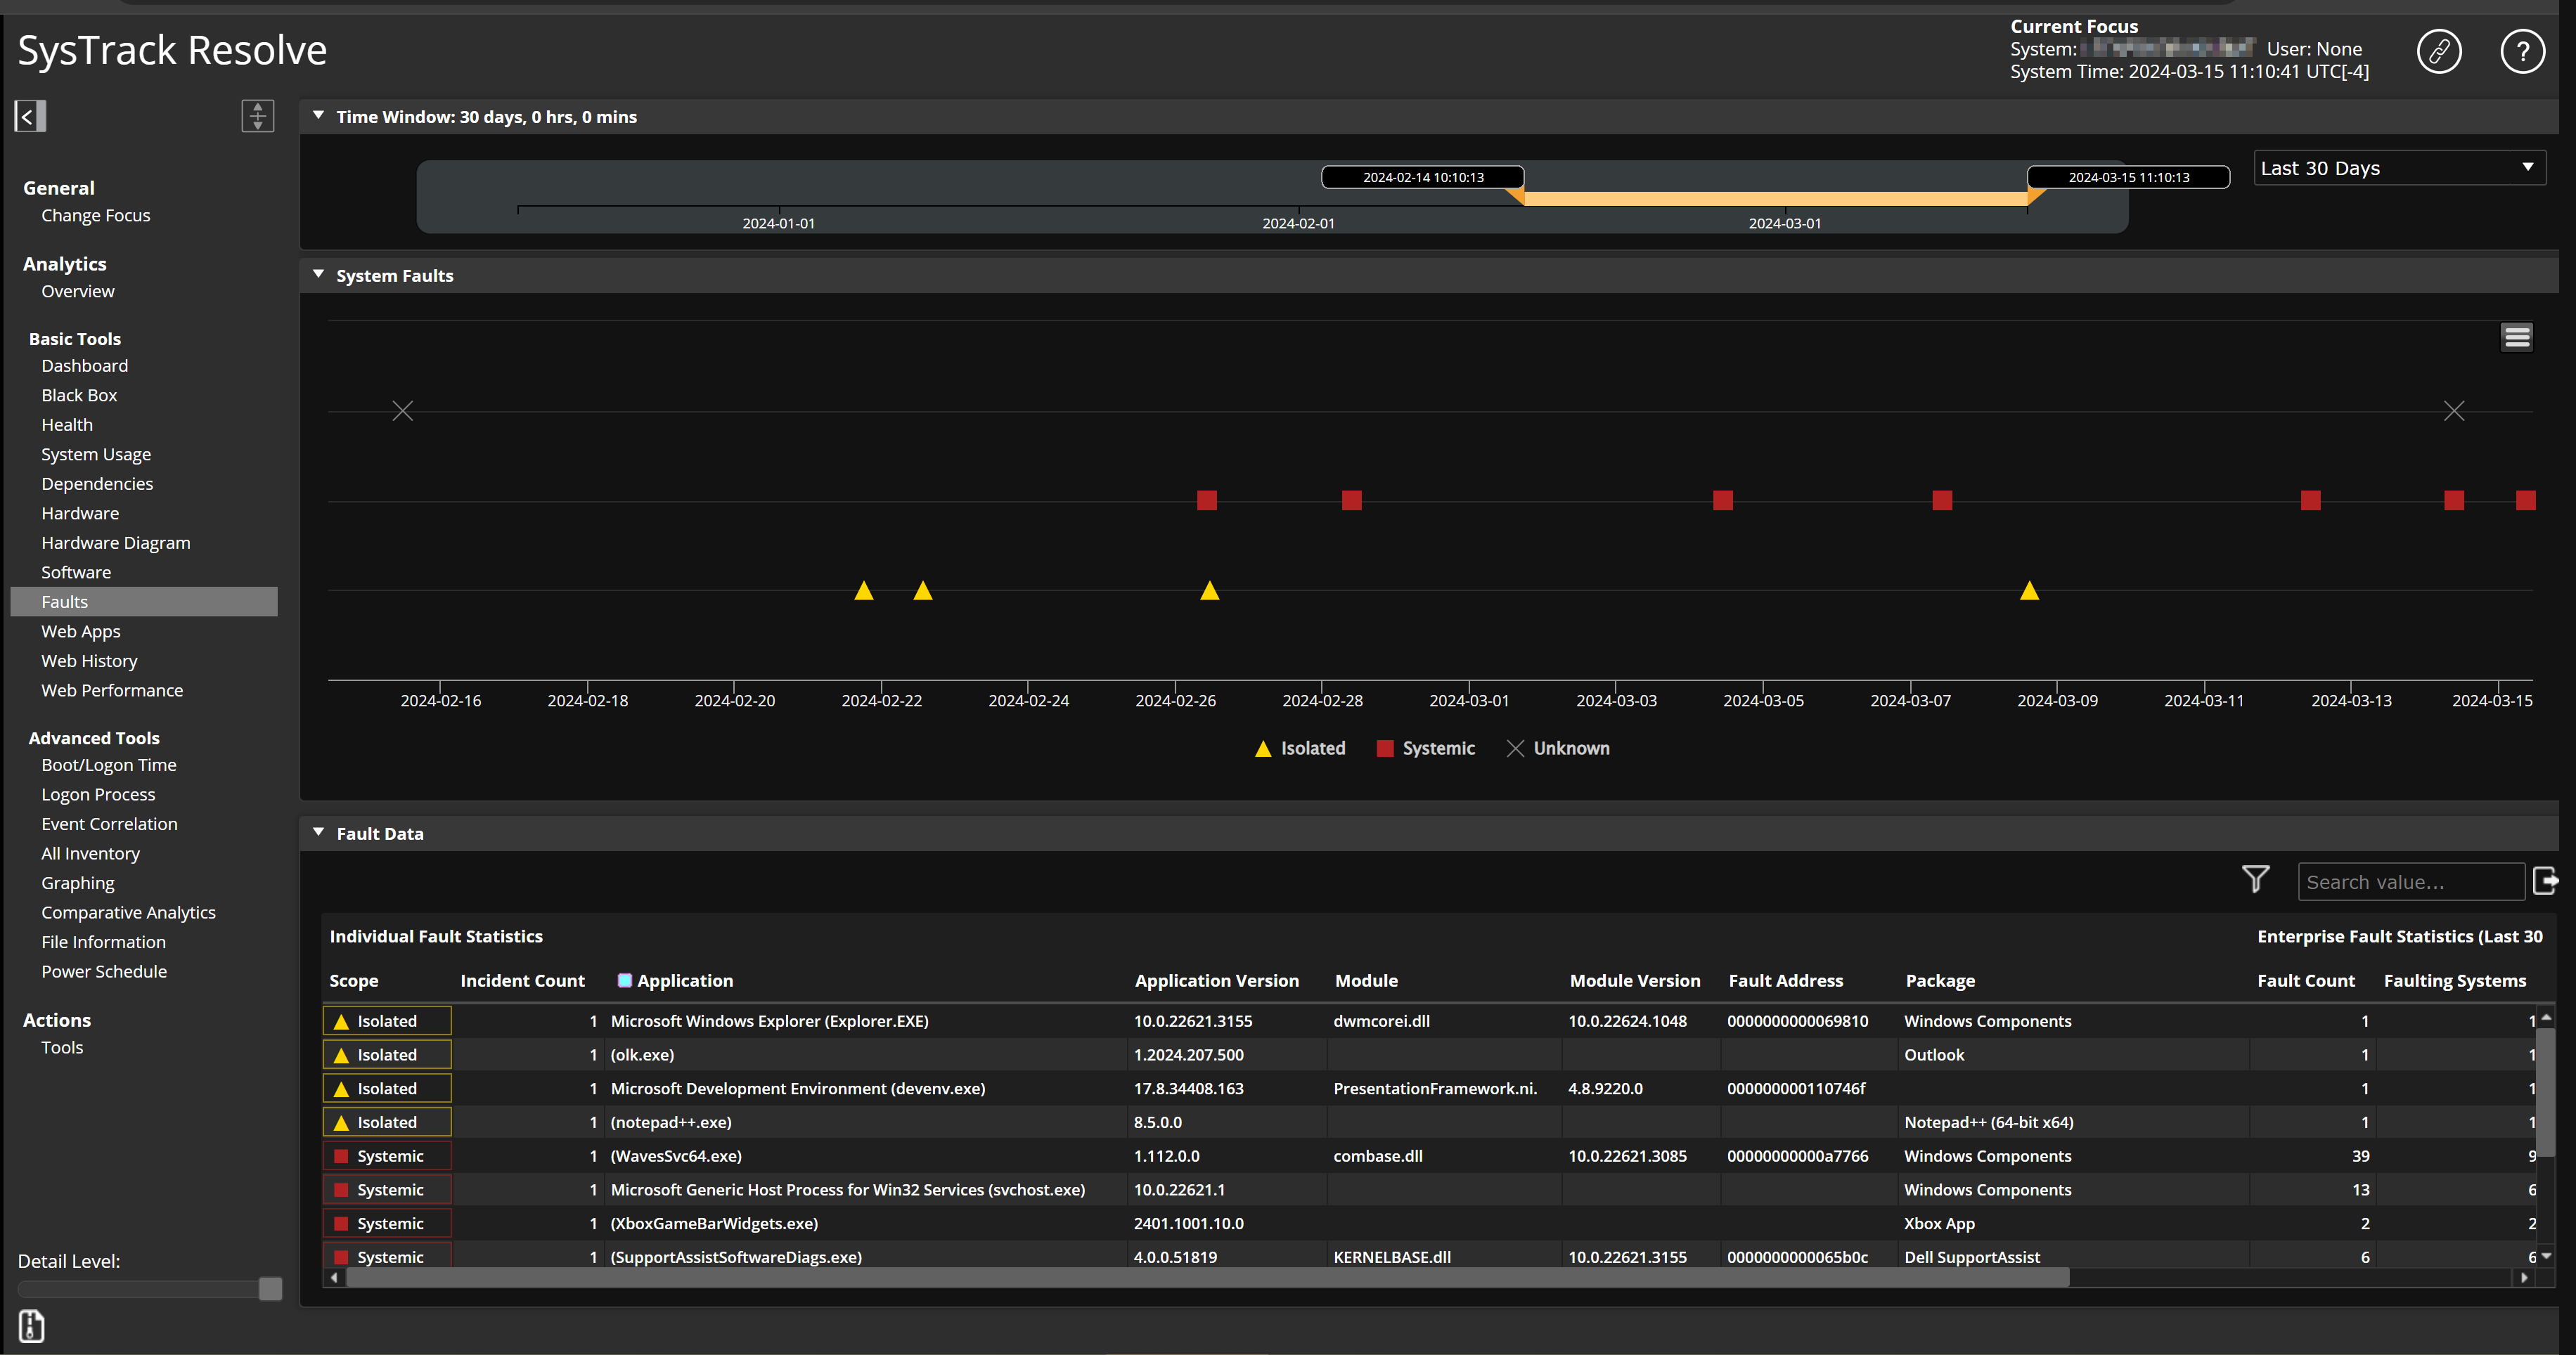
Resolve's Faults Tool enables you to investigate faults and their scope. The tool identifies the application faults that impacted a system during the selected time window.
To get started with this tool, select a focus system, configure a Time Window for the data that displays on this page, and then proceed with the following sections.

System Faults Section
In the System Faults section, the graph uses the following icons to indicate the nature of the faults and the dates on which they occurred:
-
Isolated: The fault has occurred on only the focus system.

-
Systemic: The fault has occurred on the focus system and at least one other system.

-
Unknown: Resolve was not able to gather sufficient data about the fault.

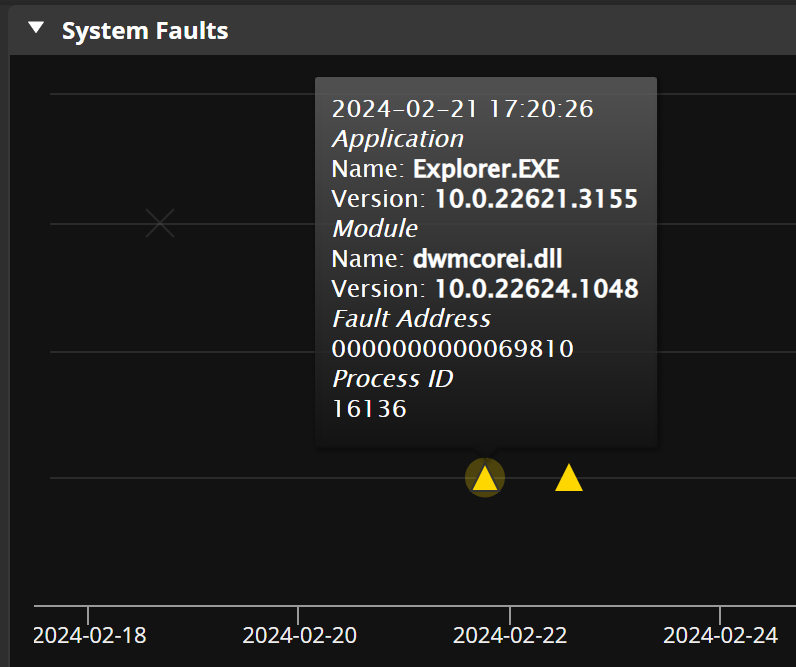
You can hover over these icons to see a box with more detailed data about each fault.

Fault Data Section
In the Fault Data section, you see statistics about each individual fault. This section gives you many columns of data to investigate for each fault, such as Incident Count, Application Version, and Mean Time Between Failures. Double-click in the Application column for a fault from the list to open the Application in Visualizer.
Investigate with the Faults Tool
When more than one user reports application faults for the same application, it is a good practice to determine the scope of the issue. For example, how many users and which specific users are affected by the application fault? This section explains how to use the Faults tool to investigate.
To begin, use the Faults tool to identify software package faults that have impacted a system during a selected time period.
-
In the Resolve menu, select Faults.
-
If you haven't already selected a system, use Change Focus to find and select the system that you want to investigate.
The Faults Tool populates with data about the system.
-
Configure a Time Window for the data that displays on this page.
-
In the System Faults section, look at the Isolated and Systemic faults. It is a good practice to further investigate systemic faults. Review the data and note the date when the fault occurred.
-
Switch into Visualizer.
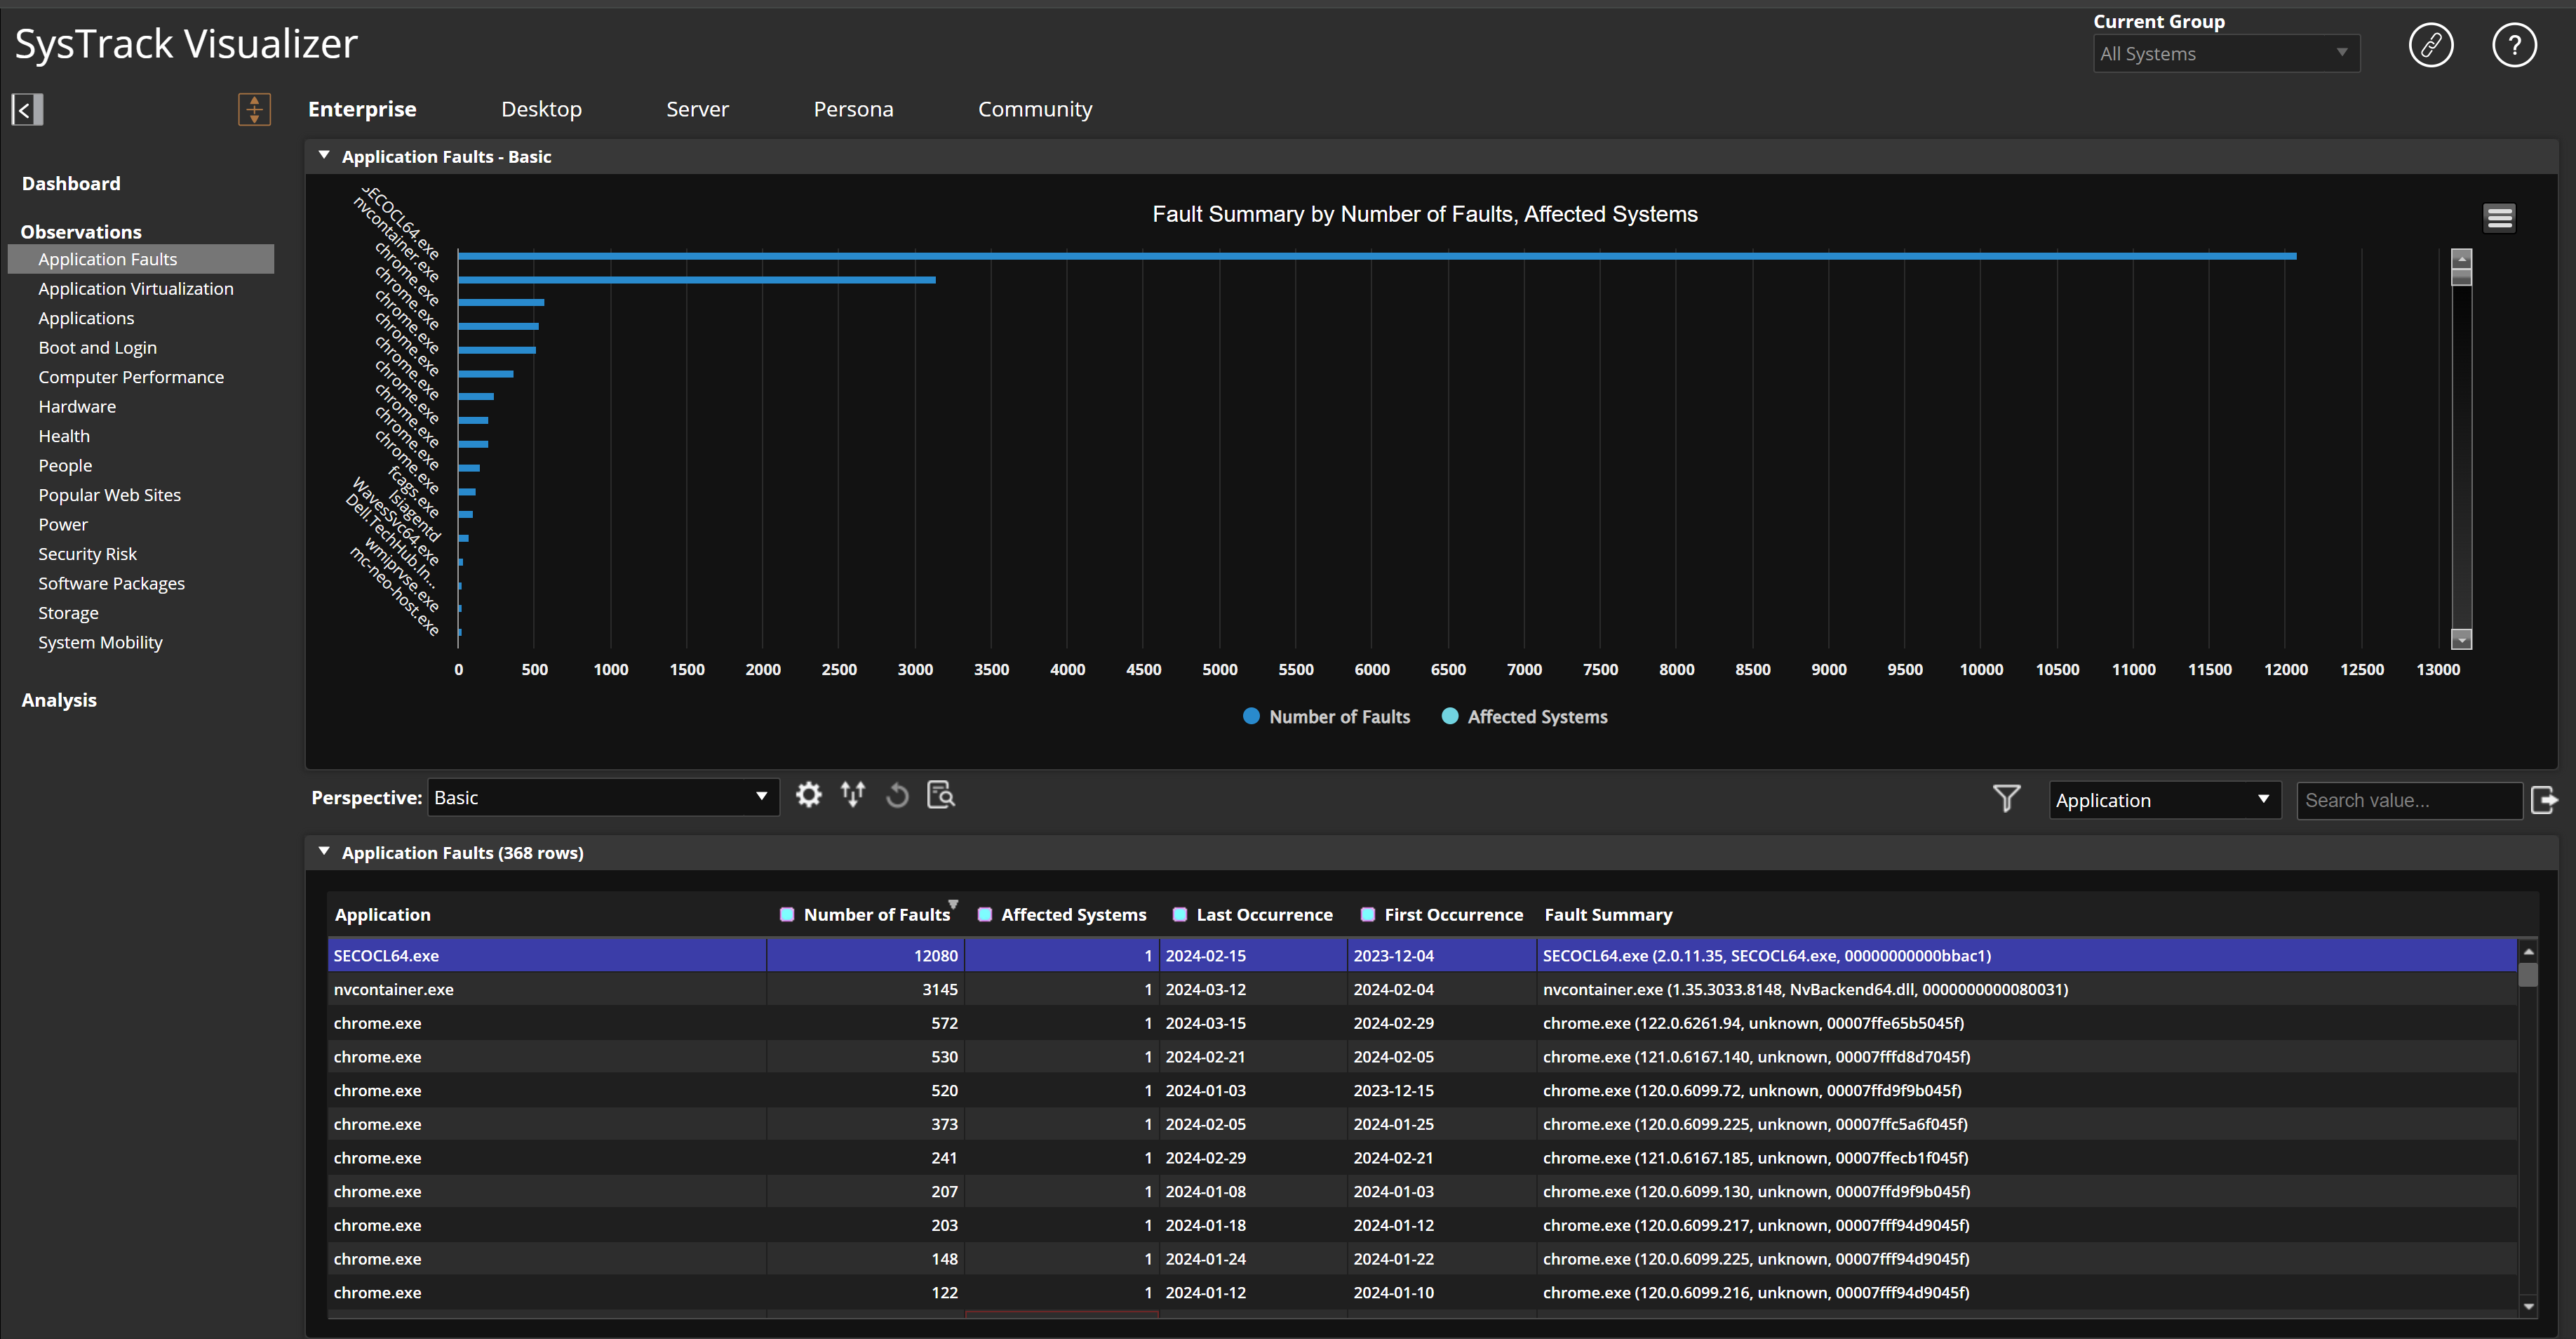
You can use Visualizer to further investigate the fault. In the Application Faults - Basic section, you see a graph of the fault summary by number of faults and affected systems. In the bottom section, named Application Faults, find the fault that occurred on the date you noted. To quickly determine which systems have been affected by the fault, double-click on an Affected Systems value to see a Drilldown Detail box with more information.

On This Page