Notifications
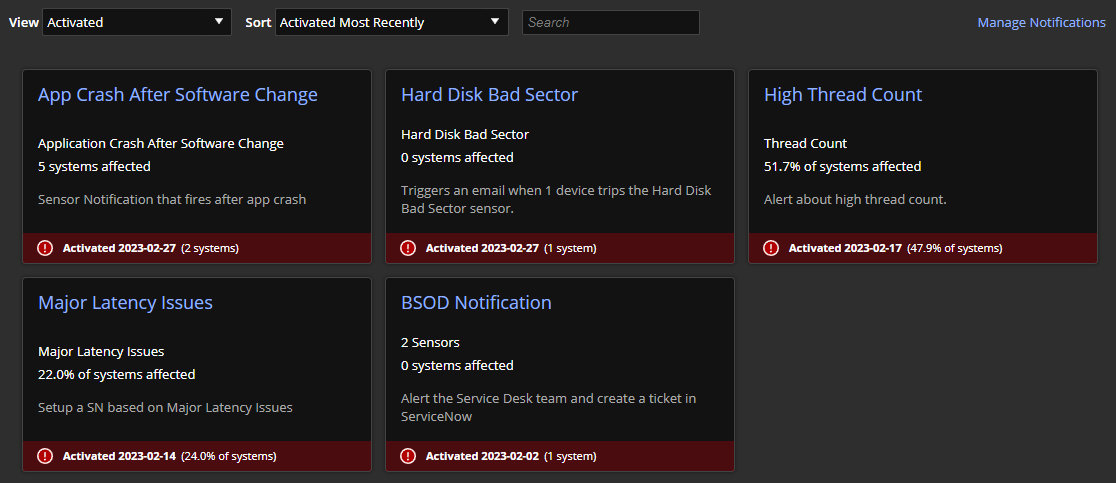
SysTrack can be configured to automatically send a sensor notification via email or webhook to one or more people. The Notifications page provides a view of the sensor notifications that have been activated in your environment. Each instance of a notification is represented by a card listing the name and other relevant details. Activated notifications are shown by default with the most recently activated notifications at the top. Use the Search field to find any cards with a matching name. When you click a card, it shows a detailed view of the notification, including affected systems and history.
For details about running a tool in Prevent, see Prevent's Tools Page.
Manage Notifications
Use the Manage Notification link to go to Sensor Notifications and configure notifications, including anomalies.
NOTE: The Manage Notifications link in the upper right goes to the Notifications page in Configure. Use this page to view, edit, and create sensor notifications. This link does not appear if you do not have access to this Configure page.
-
Click Manage Notifications. The Configure > Notifications page opens.
-
For more information, see Sensor Notifications.
Details and Status of Notifications
Each notification card includes the notification name, the sensor name or number of sensors, the number or percent of affected systems, a description, and the notification status. If multiple sensors are tied to a notification, hover over the number of sensors to view the names of each sensor.
The status of a notification card in Prevent can be Activated, Dismissed, or Resolved. The View drop-down list lets you choose which cards are displayed. The Sort drop-down list lets you reorder the displayed notification cards alphabetically, by number of activations, or by most recent activation time (default).
The bottom portion of each card shows the status of the notification and the date on which it was activated, dismissed, or resolved. Active cards also show the number or percentage of affected systems. Activated status is indicated by an exclamation point and red background  . Dismissed status is indicated by an X and gray background
  . Resolved status is indicated by a check mark and green background
  .
.
Work with Notifications
To view the details for a notification card, click the card.
If the notification you are viewing is Activated, you can click Change Status in the upper right to Dismiss the activation if it can be ignored or set it to Marked as Resolved if the issue has been corrected.
Both status changes reset the notification, so email alerts will be sent if the notification activates again. If you have access to the Notifications page in Configure, you can click Manage to open the notification in that page. For more information, see Sensor Notifications.
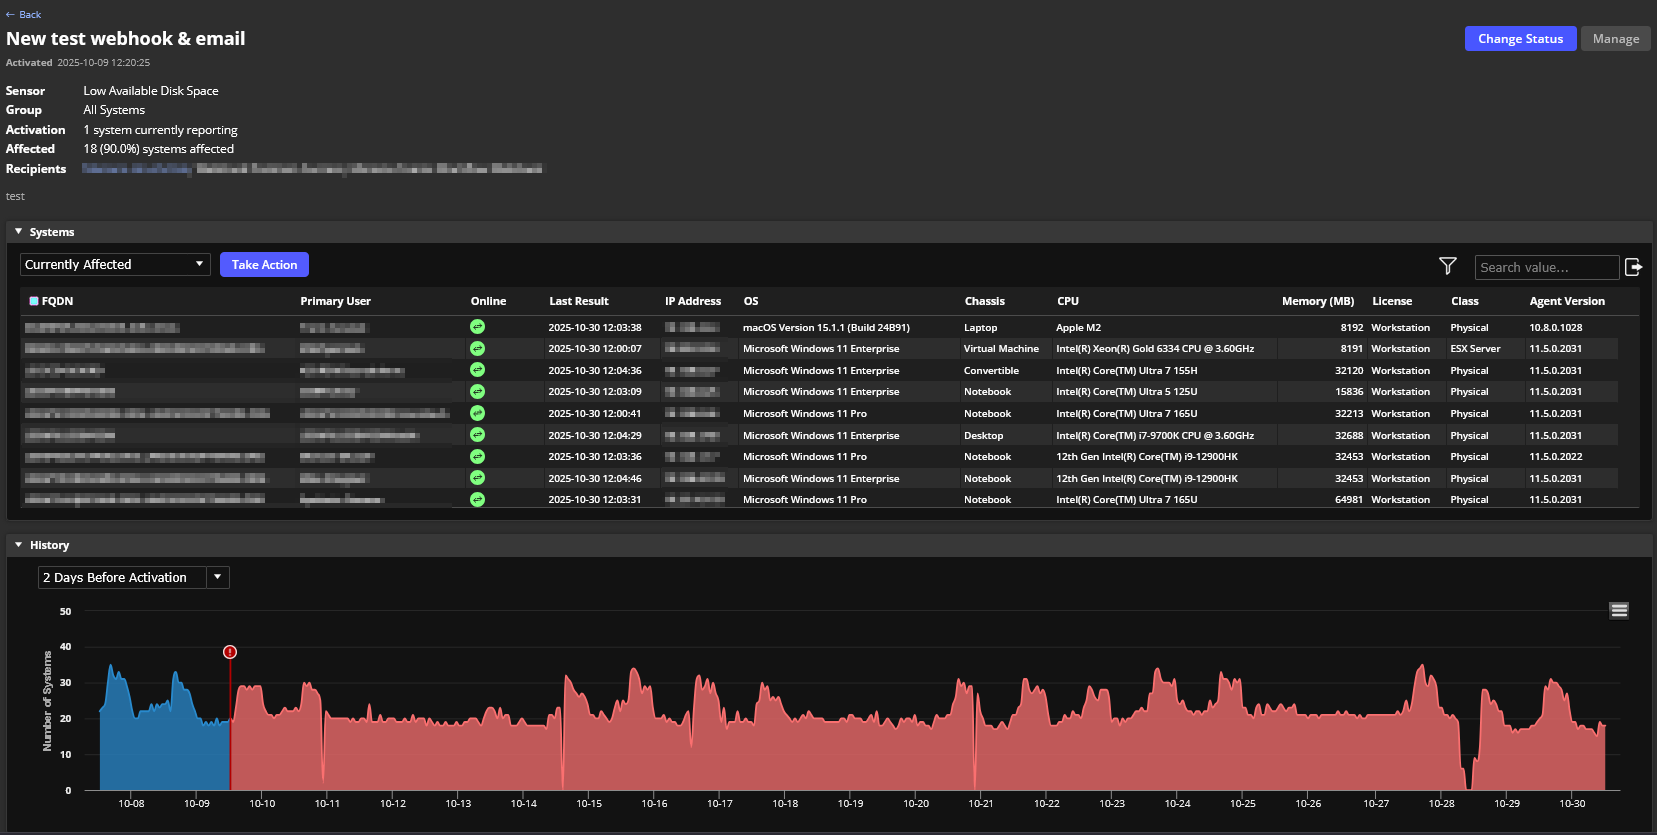
Details about the selected sensor notification are shown in the upper left, including the name of the notification and the date and time when it was activated. Additionally, this section displays the involved sensors, the group of monitored systems, the activation threshold, the number or percentage of systems currently affected, the recipients of the notification email, and the description of the sensor notification.
The Systems table shows data about affected systems. The drop-down list lets you view either currently affected systems or systems affected when the notification activated. This table includes system details such as OS, Chassis, and Memory. You can click the button in the upper right to export the table.
The History pane charts the number or percentage of systems on which all the sensors for the selected notification have been triggered. Contrasting colors show when the notification has been activated. Status changes of a sensor notification are shown by a vertical line with a symbol at the top: a red exclamation point indicates an Activated notification, a gray X indicates a Dismissed notification, and a green check mark indicates a Resolved notification. Hover over a symbol to display the date, time, and either the number of affected systems at activation or the name of the user who dismissed or resolved the activation.
Use the drop-down list to view data for the Last 30 Days, the Last 7 Days, the time Since Activation, or 2 Days Before Activation (default). Use the menu in the upper right to view the chart full screen, print it, or download it in a variety of formats.
To run a tool on systems affected by a sensor notification, select the appropriate icon. You can run an automation or collection extension, or send an engagement, survey or alert.
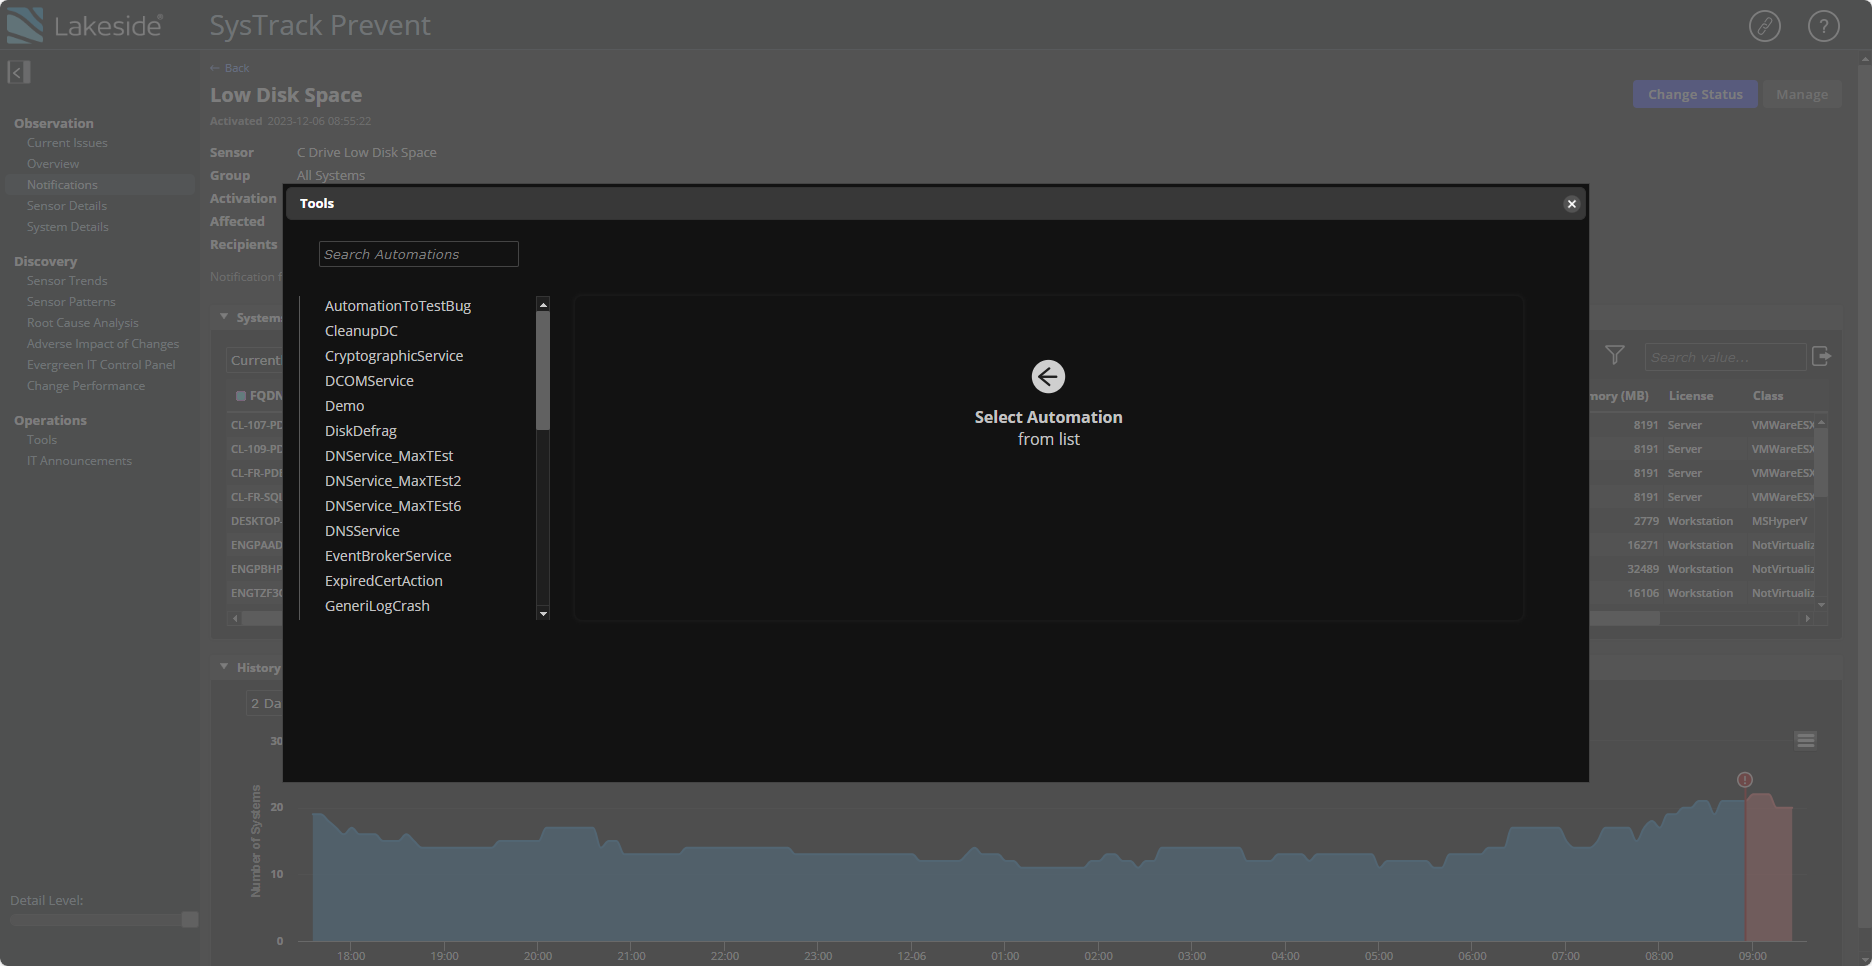
For more details about the actions you can take with System icons, see Sensor Details.
On This Page