AI Awareness User Guide
Overview
This DEX pack provides information on the usage of AI applications and Web Apps,hardware readiness for Copilot+ and systems and applications consuming NPU resources. The pack contains three dashboards: AI Usage, Copilot+ Readiness, and NPU Assessment.
How This Feature Helps You
The AI Awareness dashboards offer valuable insights that support the effective adoption and management of AI technologies across the organization. Key benefits include:
-
AI Utilization Tracking: Provides visibility into how AI applications and web apps are being used, including metrics such as number of users and time spent, enabling teams to monitor adoption and usage trends.
-
Copilot+ Readiness Assessment: Identifies which systems meet the minimum requirements for Copilot+, highlighting devices that are ready, those that require a RAM upgrade, and those needing a Windows 11 upgrade.
-
Informed Decision-Making: Equips managers with the data needed to guide procurement strategies and ensure compliance with AI usage policies.
These capabilities help drive smarter investment decisions, improve AI readiness, and ensure responsible AI adoption across the enterprise.
AI Usage
This dashboard provides visibility into how AI tools are being used across the organization.
AI Usage Summary
This pane lists AI tools such as Copilot and ChatGPT, distinguishing between desktop and web-based versions. It shows the number of users engaging with each tool, along with usage duration and average time spent.
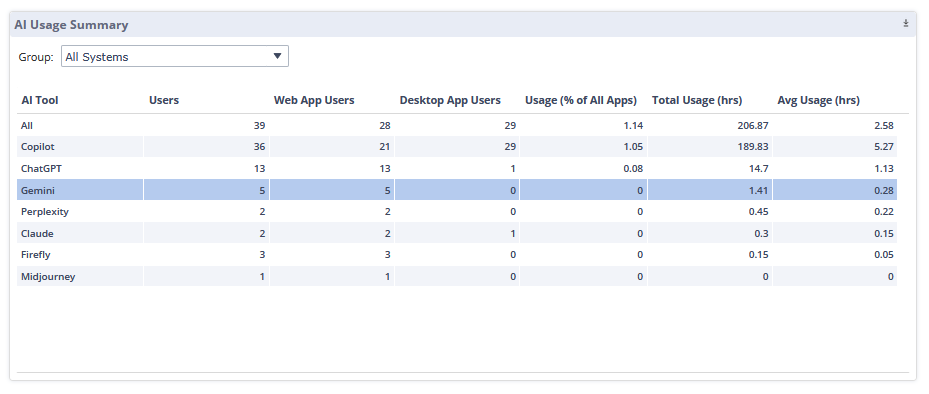
Use the Group drop-down to narrow the data view to a specific group of systems.
The list of currently supported applications by default is as follows:
-
ChatGPT
-
Claude
-
Copilot
-
Firefly
-
Gemini
-
Jasper
-
Midjourney
-
Perplexity
If you need to add custom applications, follow the guide at the bottom of this article.
AI Total Usage Time
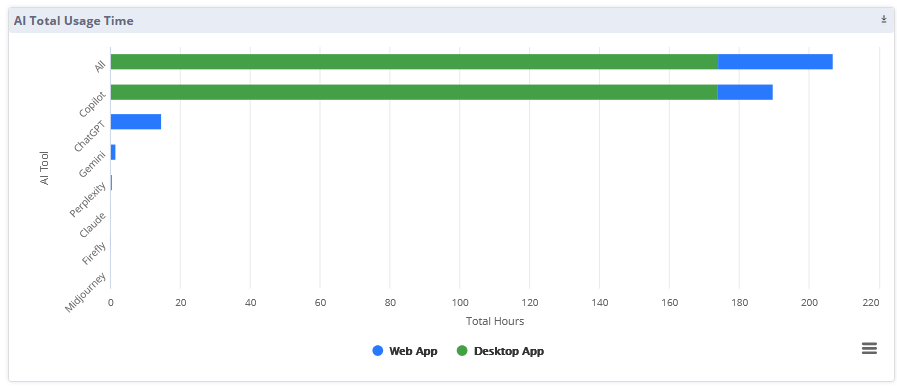
This pane Includes a visualization comparing desktop versus web app usage.
Selected AI Tool - Systems
In this pane you can see detailed data for the applications you select in the AI Usage Summary pane.
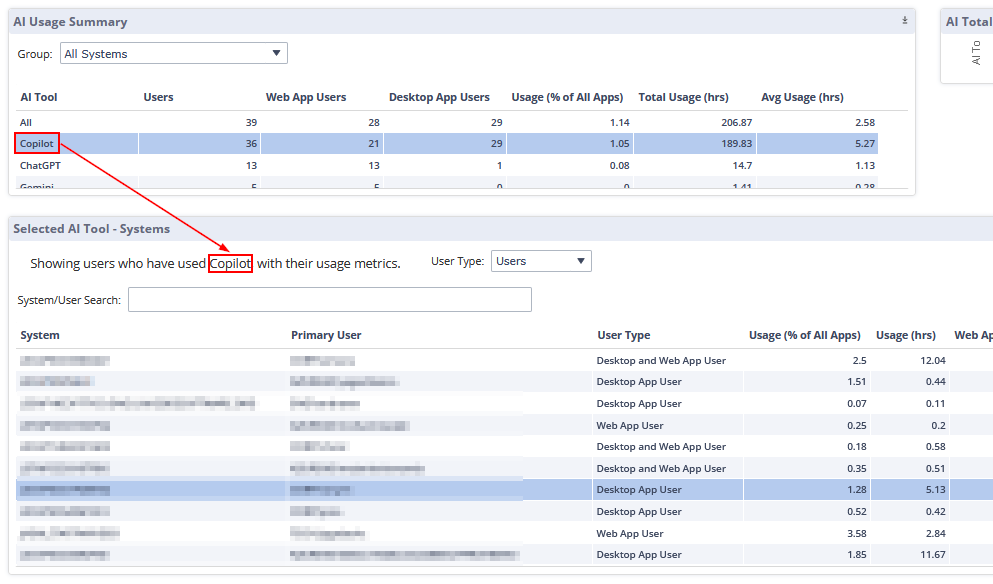
You can use the User Type drop-down to refine the data view:
-
All: Displays data for all users, regardless of usage.
-
Users: Displays data only for users who have used the selected application.
-
Non Users: Displays data for users who have not used the selected application.
Use the System/User Search text box to filter data by entering the full or partial name of a system or user.
Copilot+ Readiness
This dashboard assesses whether systems meet the minimum requirements for Copilot+.
Global Filters
Use the Group drop-down to narrow the data view to a specific group of systems.
Minimum System Requirements
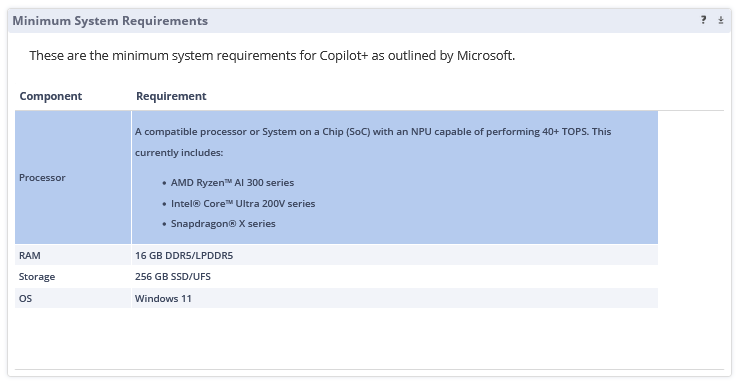
Here you can find the minimum requirements for using Copilot+.
Readiness Summary
This pane shows a chart that visualizes the readiness of systems for specific components.
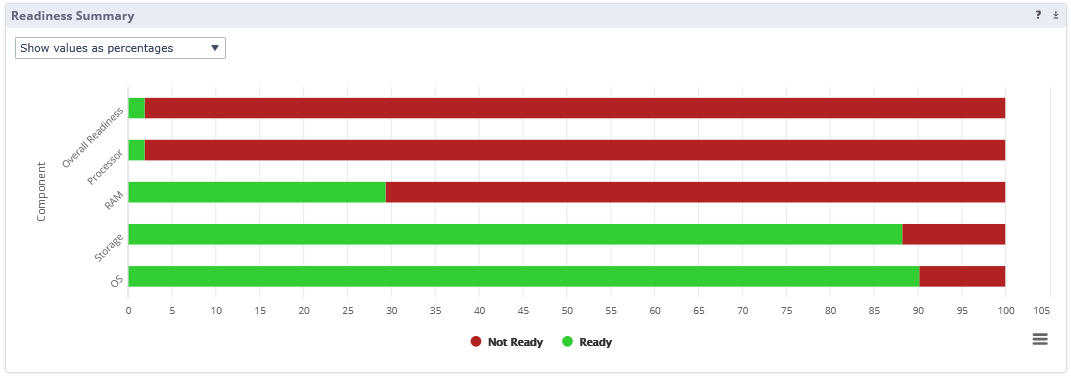
Use the drop-down at the top of this pane to Show values and percentages or Show values as system counts.
Readiness Details Settings

Use the Readiness Details View drop-down to choose the level of detail displayed below the pane:
-
Basic: Shows the Basic Readiness Details pane.
-
Full: Shows the Full Readiness Details pane.
The Filters drop-down can be used to Show or to Hide the Filters pane:

Use the available filters to show or hide columns in the readiness details pane, or to filter systems by name as needed.
Basic Readiness Details
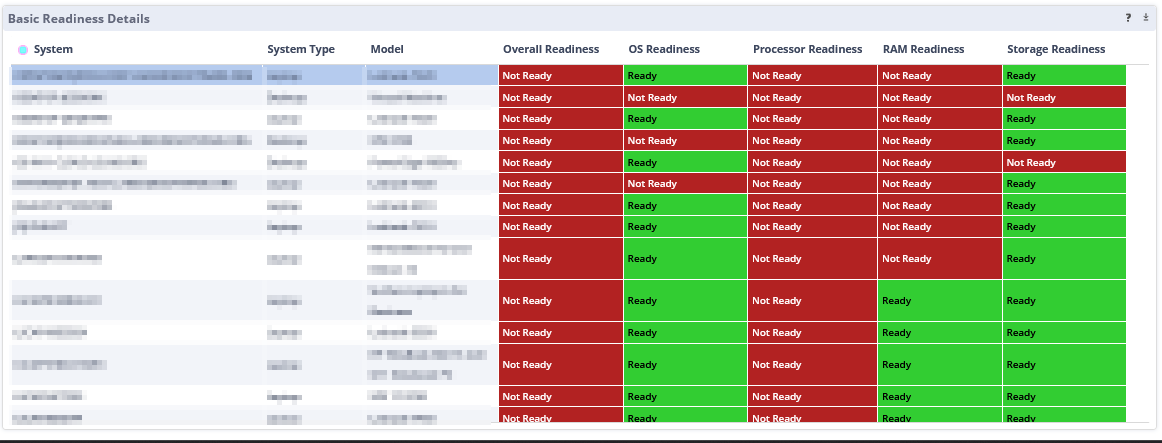
This pane lists all the systems in the selected group and shows whether they are Ready or Not Ready for each of the components listed in the Copilot+ requirements.
Full Readiness Details
This section displays complete information for each component required for Copilot+:

NPU Assessment
This dashboard will help you determine the applications in your environment that use the Neural Processing Unit (NPU) in the latest laptop devices.
NOTE: The NPU Assessment dashboard is also available as a standalone NPU Assessment DEX Pack Lite. You can find the full documentation for this DEX pack here: NPU Assessment DEX Pack Lite.
Advanced Feature - Including Additional Applications in the Dashboard
Most common industry tools are accounted for, but you can add custom ones to the list if needed. Here is how to do it:
-
Go to Dashboard Builder.
-
Open the AI Awareness - AI Usage dashboard.
-
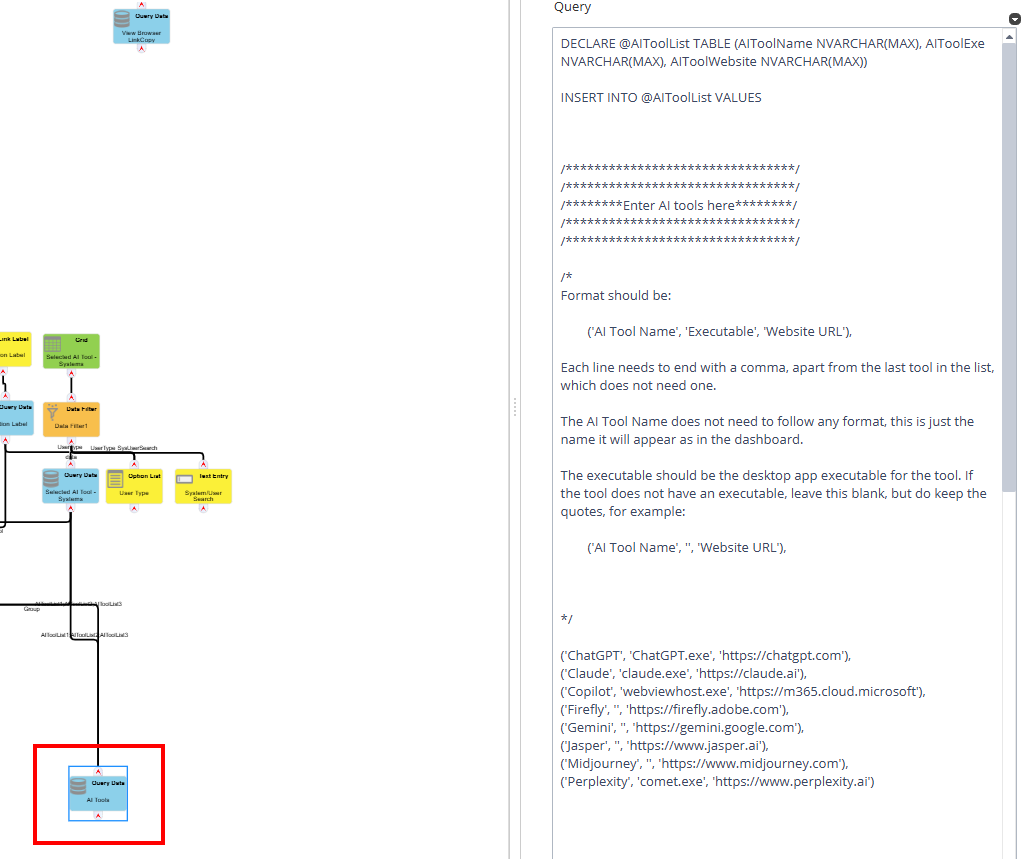
Select the blue AI ToolsQuery Data block at the bottom.
-
in the query section on the right, add more tools as needed.
-
Click Apply at the bottom right to save your changes.
-
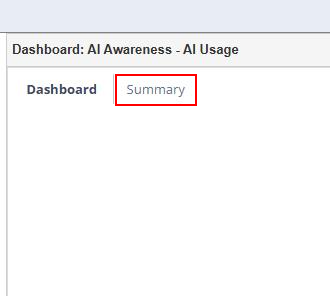
Go to the Summary tab at the top of the screen.
-
In the AI Tools query block, repeat the same changes and click Apply.
On This Page