AppVision Overview
AppVision provides detailed application data including usage, resource consumption, faults and installation summary. It includes all the application data in Visualizer with more details.
You can see data for All Systems or for a specific group.
The "Usage" page is only available for groups which are enabled in Configure. "Usage" is not available by default in the cloud.
Dashboard
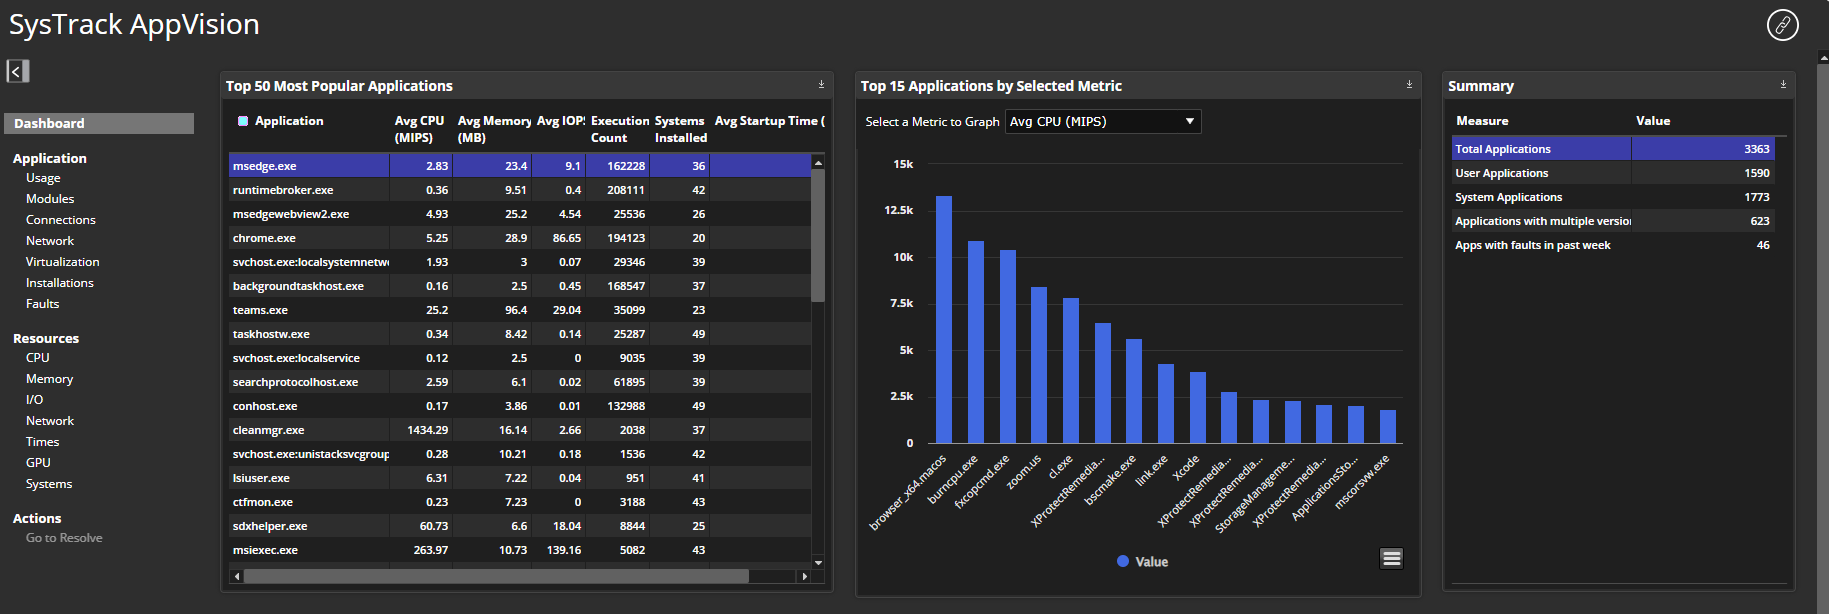
The dashboard provides a summary of information about the applications, their usage and resources consumed.

Top 50 Most Popular Applications includes the resources and performance which are also covered in Visualizer.
Top 15 Applications by Selected Metric on a graph. Choices include Average CPU, Average Memory, Average IOPS, Average Startup Time, and Execution Count.
Summary of the applications, by Total, User, System, Multiple versions, and with faults in the past week.

Top 50 Applications by Fault Count vs Systems Installed shows the fault counts by installed systems. You can view the chart in full screen, print it, and download it in one of the formats on the menu.
Fault Details for Selected Time Frame include start and end times by minutes, hours, days, and years. You can search for the application or select one from the grid which includes Application, Version, Module, Module Version, Fault Type, and Fault Time.
Topics in This Section
On This Page