Home >
View Health Operations
The Health Operations page provides a view of virtual centers displayed hierarchically in a pane comprised of the following hierarchy levels:
- Virtual Centers: The hierarchy's top tier; the super set. An environment can have multiple virtual centers. These centers act as management servers that manage multiple Hypervisors.
- Data Centers: A physical or logical facility used to house computer systems and associated components. Logical data centers are hosted in the same place, with each often serving a different purpose.
- Clusters: Data Centers can have a grouping of Hypervisors within them; each grouping is called a Cluster. A popular configuration is to set up Hypervisor clusters that each host Virtual Machines that serve a common purpose such as lab systems, user systems, or servers.
- Hypervisors: Virtual Machines reside on a Hypervisor (the terms Hypervisors and Hosts are often used interchangeably).

All items, both the infrastructure items and the Computers, use color coding to indicate health:

- Click an infrastructure hierarchy node (such as a Data Center, Cluster, or Hypervisor) to filter data for the currently selected node.
- To return to the topmost node, click the Reset icon on the top right of the page.
- To open the Health Investigation page with the data filtered for the currently selected node, click the Investigate icon.
- To reorder the virtual centers on the page, mouse over the title bar of a pane to display a cross and then drag the desired virtual center pane up or down on the page. To revert to the original order, click the Reset Order icon.
- If you have a large site, you may find it convenient to review data for a subset of the site's systems. Use the Group drop-down menu to select to view data for All Systems or to view data for a specific group of systems.
Note: Groups are added/configured via SysTrack Deploy.
- The Show Virtual Machines and Show Physical Devices check boxes allow you to control which device type's data is displayed. The example below shows the default selection, only Show Virtual Machines is checked. In result, data is displayed only for Virtual Machines in the selected Group. If you want to display data for all types of devices for the selected Group, you would check both boxes.
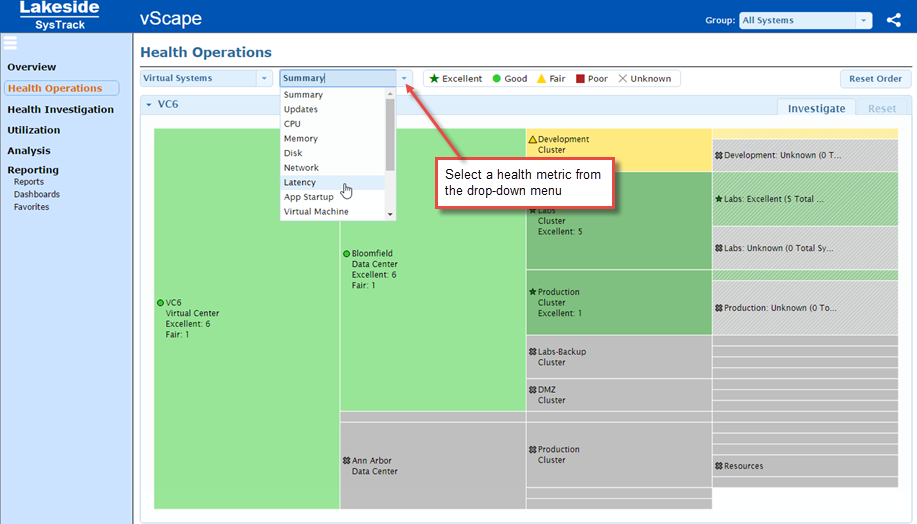
- If you wish to change the health metric (default is Summary), click the drop-down menu as shown below and select a metric from the list.
On This Page