Use the vScape Overview
The vScape Overview page takes advantage of the continuous feed of real-time application resource usage to the master system to provide real-time application data for the selected group of systems and device types.
The systems’ application data is collected and then aggregated to provide the data displayed in the System pane (CPU, andMemory), and the Disk pane (IO Reads, and IO Writes).
Up to now, one of the biggest questions that has been difficult to answer is what percentage of the infrastructure (the percentage of the environment's capacity) is occupied by specific applications. The Overview page allows you to answer that question. In the classic case, if there is an anti-virus application scheduled to run concurrently, there will be numerous sessions consuming shared resources which can result in performance issues. The real-time data can give you the information you need to determine that a co-scheduled event is the cause of poor system health.
Select the System Group and Device Type(s)
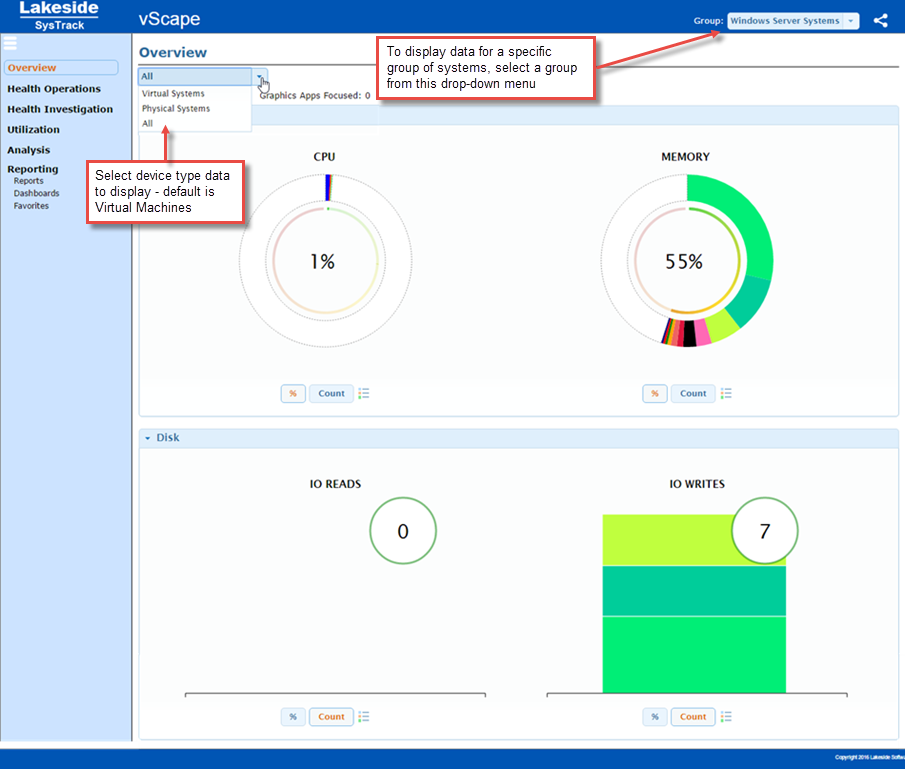
The default settings are to show data for the All Systems Group and for only Virtual Machines in that Group.
- If you would like to display data for a specific group of systems, click the Group drop-down arrow and select a group from the resulting list.
- To change the device type select another option from the drop-down list: Physical Systems, or All (includes both Virtual Machines and Physical Systems).
TIP: Groups are added/configured via SysTrack Deploy.
Display Count and Percent Views
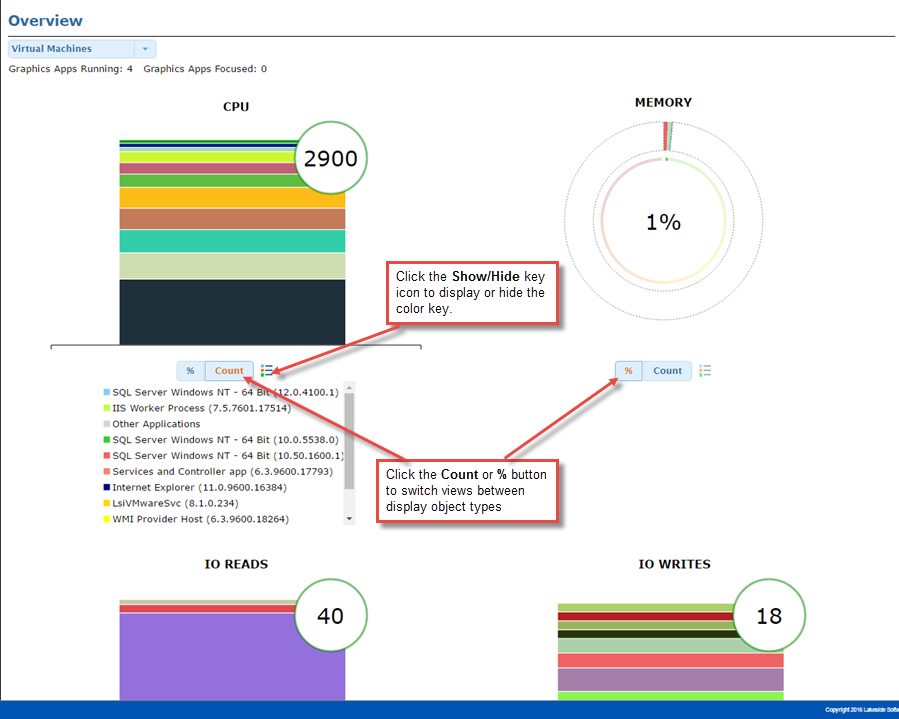
- Choose to display either Count or Percent views for each of the four CPU, Memory, IO Reads, and IO Writes panes by clicking on either the % or the Count buttons.
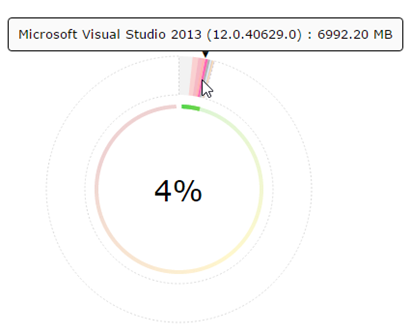
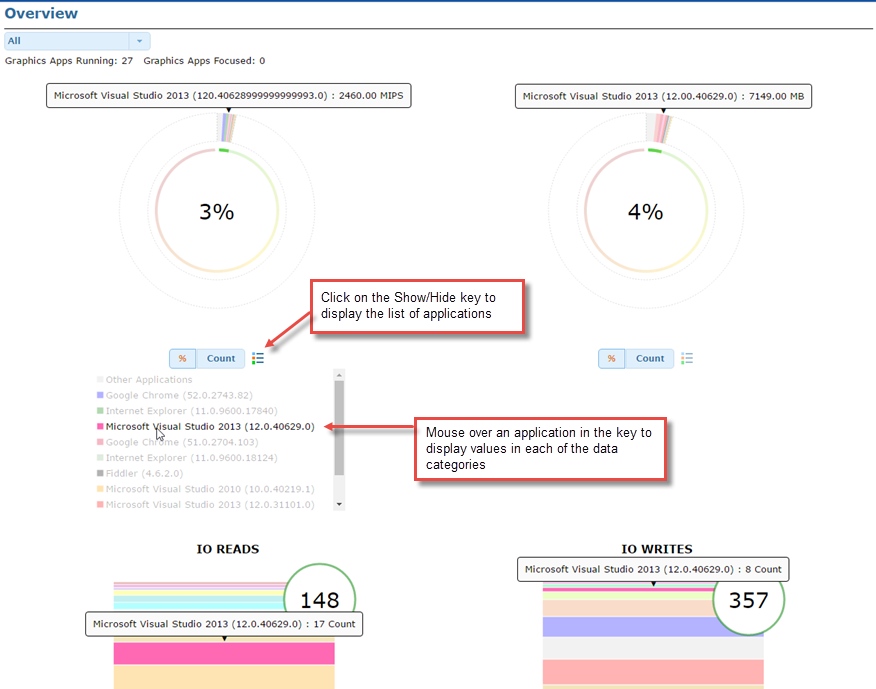
- Percent displays a circle containing within it the percent of consumption against the highest recorded in the past 30 days. In the example below, Memory was 4 %. Mouse over each segment of the outer ring to see how many resources each application is using out of that percentage.When there are performance issues in the environment, these statistics can be helpful. For an individual computer, an application may not be consuming a lot of resources, but in the aggregate the application may be contributing heavily to the overall load.
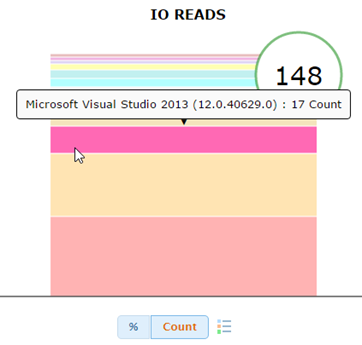
- Count displays a stacked bar chart. Mouse over each bar in the chart to see how much each application is using of each specific resource.
- Click on the Show/Hide key to display the color key, then mouse over an application in the list to display resources being used for in each of the CPU, Memory, IO Reads, and IO Writes panes.
Other useful information provided is the counts of Graphics Applications Running and Graphics Applications Focused on the top left of the page. These are any running applications that require graphics acceleration that often has a larger impact on the overall load than other applications.
On This Page