SysTrack Visualizer
The SysTrack Visualizer provides a quality measurement system that puts CIOs, administrators, and help desk technicians on the same page by providing a uniform system that promotes role-appropriate views on a common data mine.
SysTrack Visualizer includes the following modules:
- Enterprise provides CIOs with a real-time view of what is happening within key organizational groups across the entire computing landscape.
- Desktop provides an IT manager perspective of specific systems and users with more in-depth problem diagnostics.
- Server presents metrics relevant to the various servers in an organization and allows the analysis of capacity, usage, and performance.
- Risk provides views to assist in identifying areas of potential security risk including details of application configurations and inventory, hardware, and system configurations, and installed packages.
- Virtual Infrastructure provides information about how virtual hosts are performing. Key data points are provided to analyze host usage and understand which hosts are over/under utilized within the organization.
- Persona provides abstract models of real users based on work patterns, behaviors, and tools of actual users in the environment. Personas allow IT to distill users down to a manageable number of user types and understand what a persona requires from a hardware, software, mobility, security, and software perspective. Knowing these requirements aids in effectively provisioning support resources, including budget and personnel, to maximize the end user experience.
- Community Module provides a view of what is happening within key organizational groups compared to performance from other SysTrack clients.
Together, the SysTrack Visualizer modules allow organizations to proactively manage the environment, anticipating user problems and eliminating them before they occur.
For information on accessing the various SysTrack Visualizer modules, see Navigating Between Visualizer Modules.
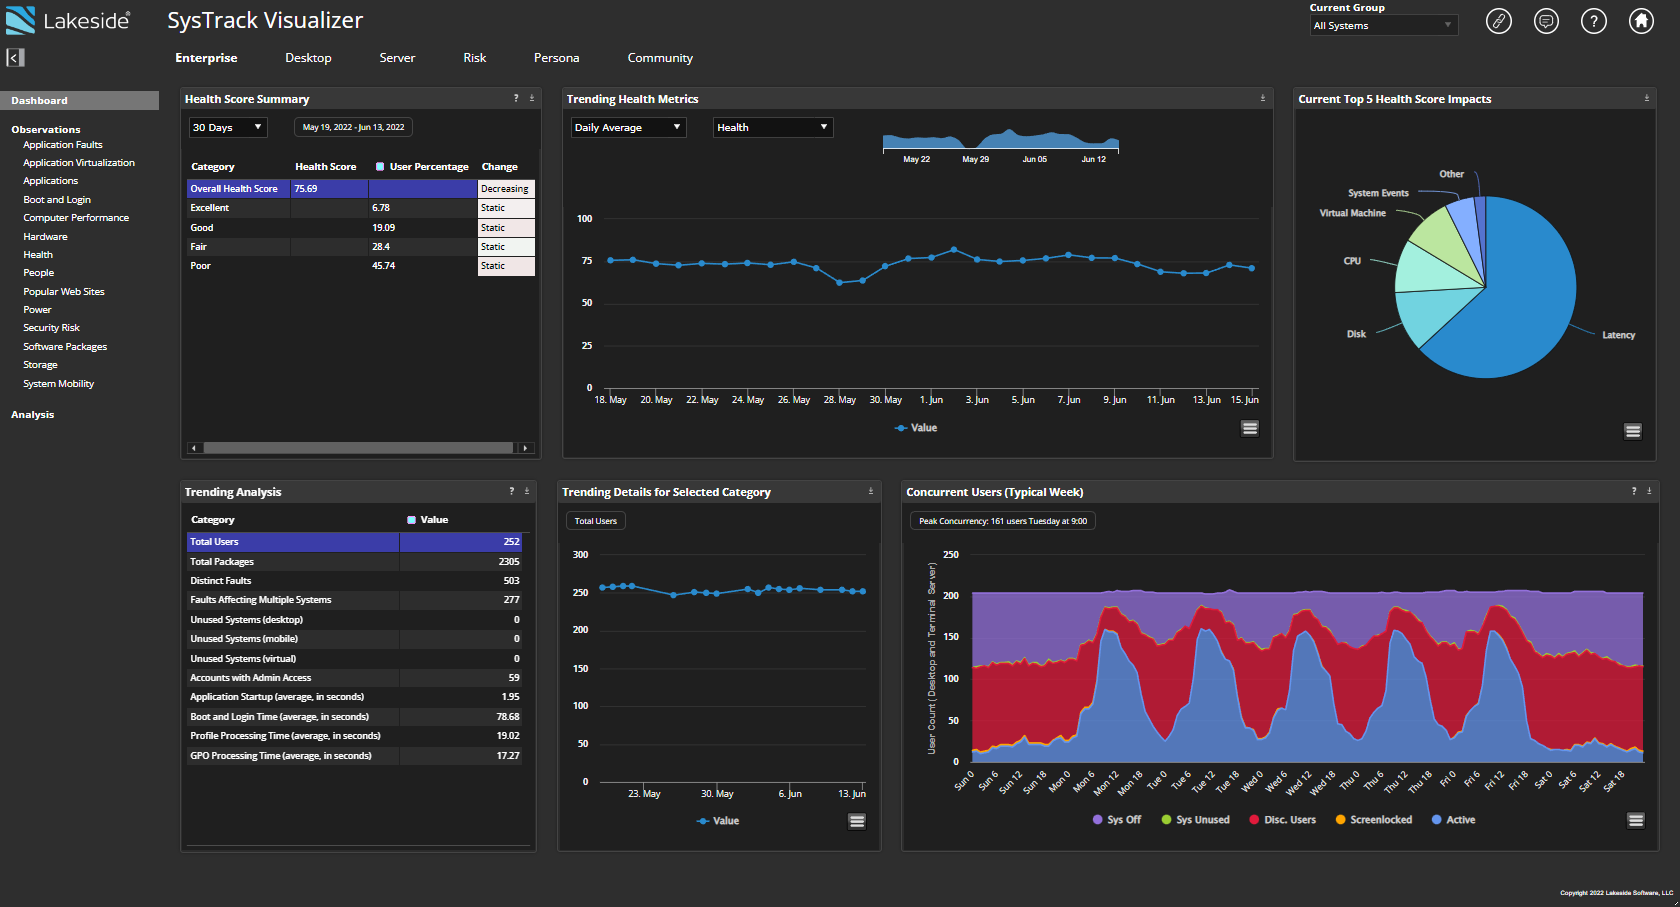
Enterprise Module
The Enterprise module presents the CIO or IT Director with an objective, high-level view of what is happening across the computing enterprise providing visibility into the end-user computing landscape that has traditionally been largely unmanaged. In order to optimize the computing environment, increase end-user satisfaction, and drive down costs, one needs critical information about the underlying systems and applications. These include, but are not limited to, reporting on end-user health score, concurrent usage, software packages, system performance, resource utilization, and security.
For more information on how to view detailed information in any of the SysTrack Visualizer modules, see View Datasets.
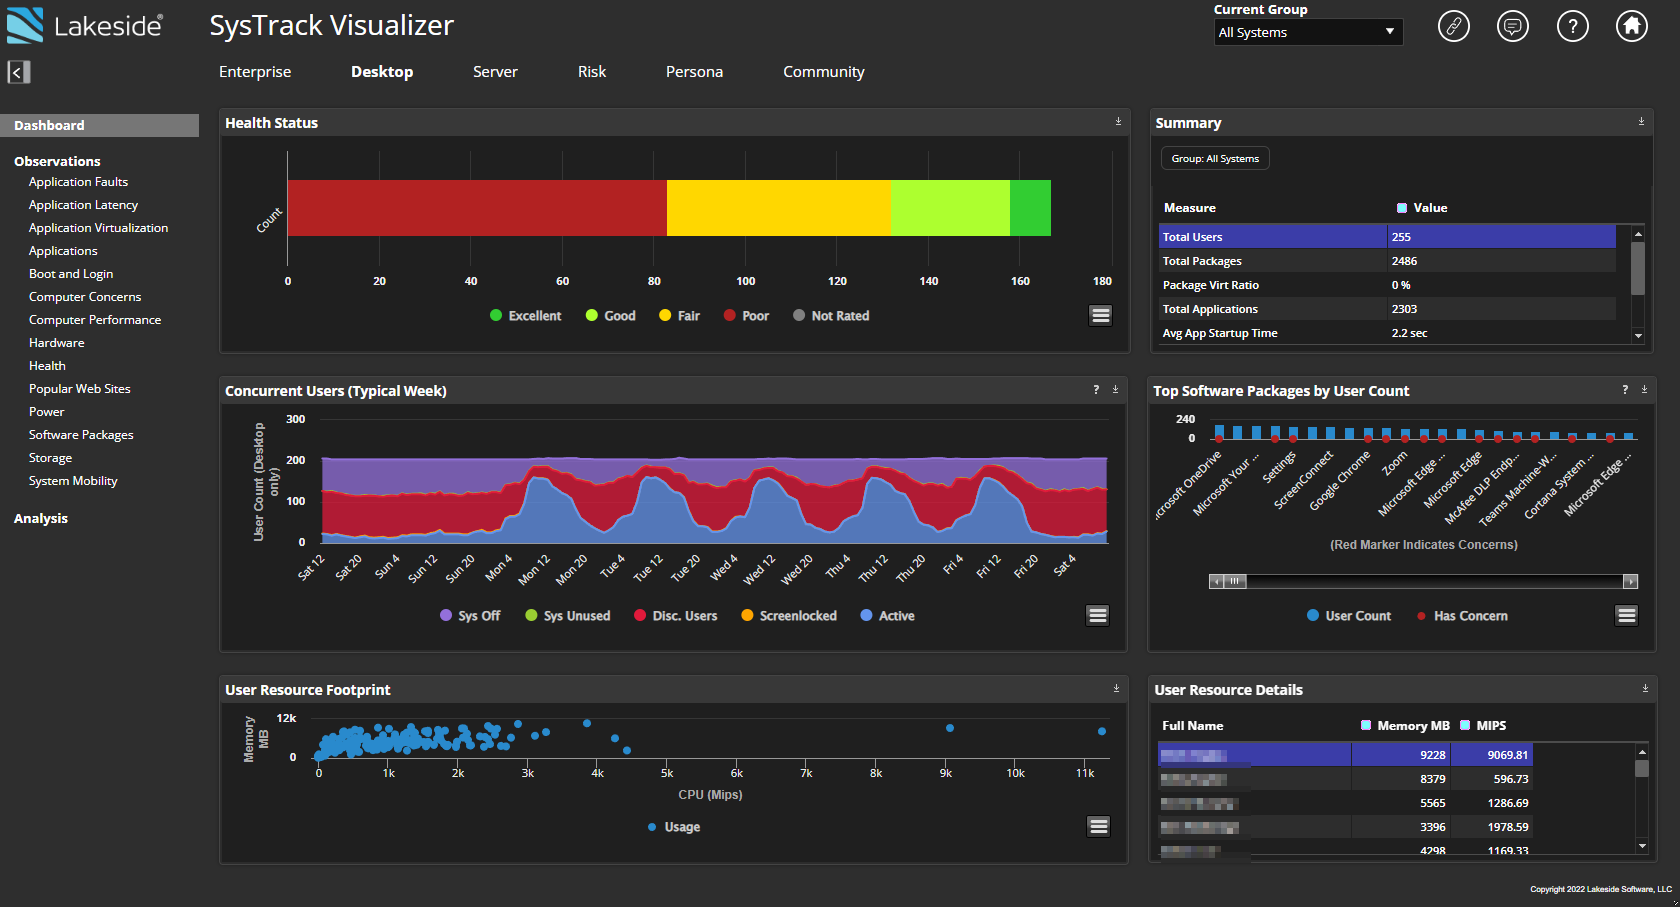
Desktop Module
While the Enterprise module provides an executive-level picture, the Desktop module presents a more detailed, IT Manager perspective of specific systems and users, providing more in-depth problem diagnostics.
The Desktop module allows you to drill-down to the individual user, system, and application level. In addition to end user experience reporting, both the Enterprise and Desktop modules provide sets of data for software packages, applications, system performance, security, people, latency, power, storage, application virtualization, and fault management.
For more information on how to view detailed information in any of the SysTrack Visualizer modules, see View Datasets.
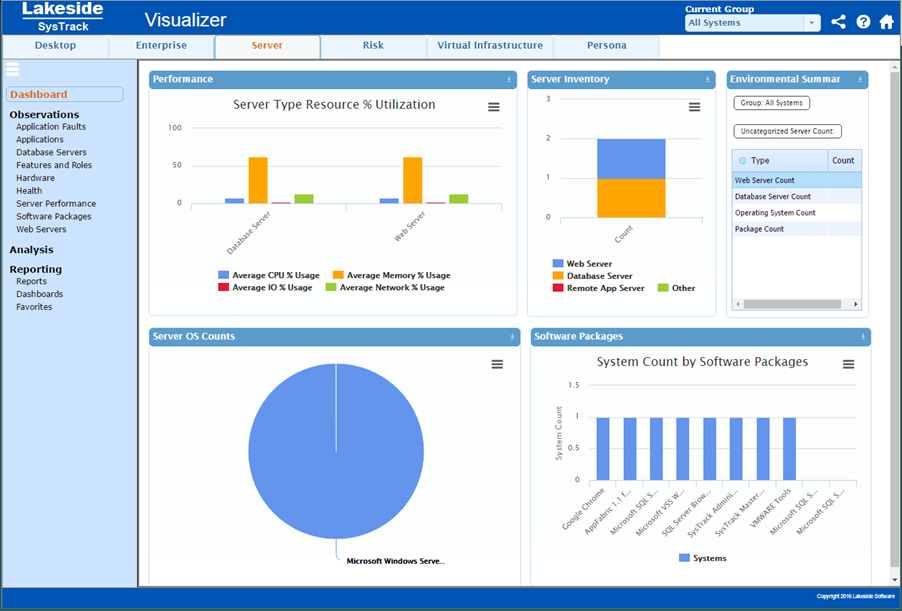
Server Module
The Server module presents metrics relevant to the various servers in an organization and allows the analysis of capacity, usage and performance.
For more information on how to view detailed information in any of the SysTrack Visualizer modules, see View Datasets.
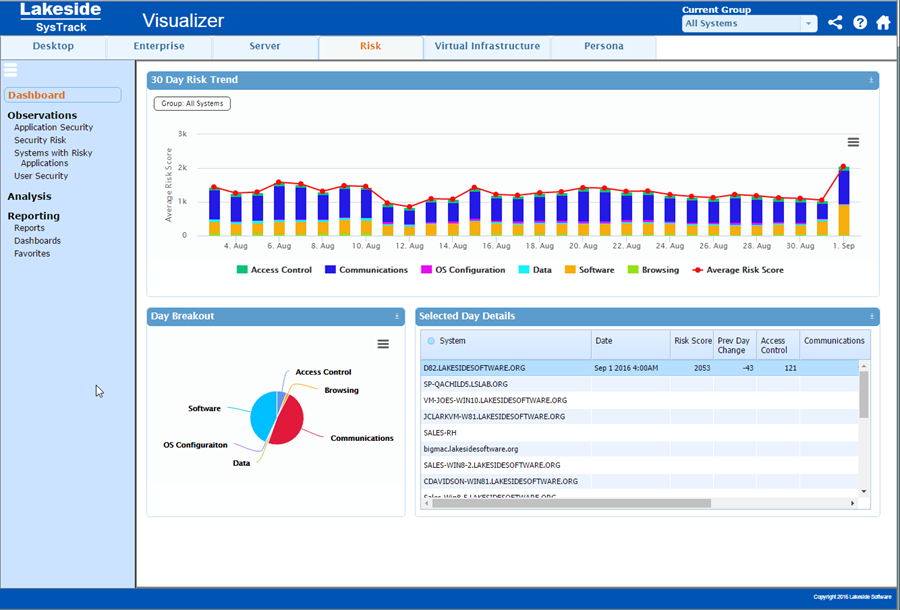
Risk Module
The SysTrack Risk Visualizer presents data views to assist in identifying areas of potential security risk including details of application configurations and inventory, hardware and system configurations, and installed software packages.
For more information on how to view detailed information in any of the SysTrack Visualizer modules, see View Datasets.
Virtual Infrastructure Module
The Virtual Infrastructure dashboard provides information about how virtual hosts are performing and presents data views to assist in analyzing the optimal utilization of host assets of an organization.
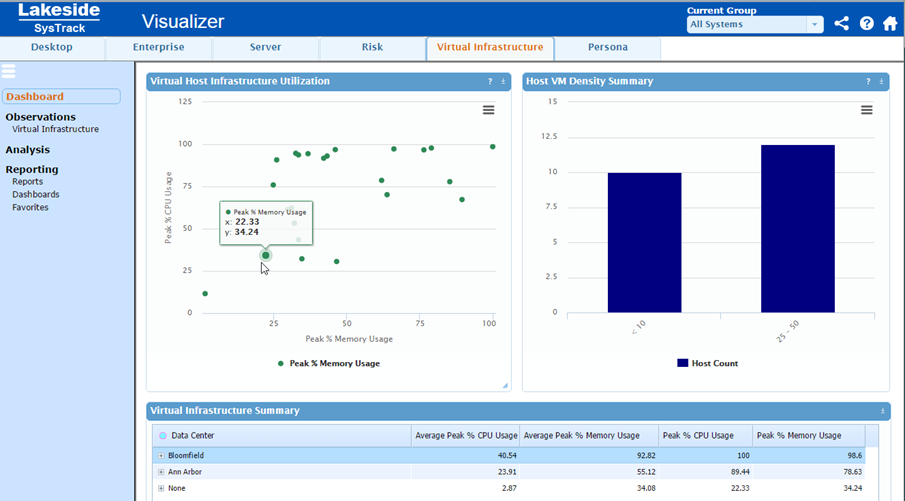
For more information on how to view detailed information in any of the SysTrack Visualizer modules, see View Datasets.
Persona Module
Personas provide abstract models of real users based on work patterns, behaviors, and tools of actual users in the environment. The Persona module distills users down to a manageable number of user types defined by Workstyle (Deskbound, Non-Deskbound, Shared, Industrial) and by Roles (Power, Task, Knowledge). Real-time data allows an organization to understand what a persona requires from a hardware, software, mobility, security, and software, perspective to aid in effectively provisioning support resources, including budget and personnel, to maximize the end user experience.
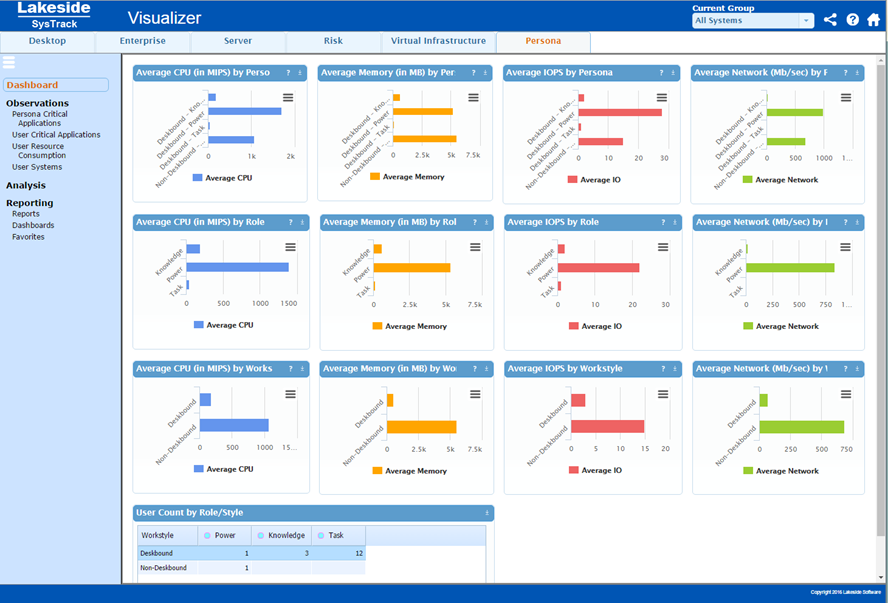
For more information on how to view detailed information in any of the SysTrack Visualizer modules, see View Datasets.
Community Module
Cloud tenants are opted into community by default. The sector and region that you select when you create your tenant will determine the community comparison used in some areas of Community Visualizer.
Community Visualizer can be used to compare selected metrics from your environment across those of other SysTrack customers, that have also opted into community. Such as:
-
Datasets from your environment with that of other customers in your region and sector.
-
Operating system versions.
-
System age.
-
Virtualized systems.
-
CPU Usage.
-
Application faults.
-
Health scores.
-
Boot and login timings.
It also sets the comparison in the Community benchmark section of Executive Insight.
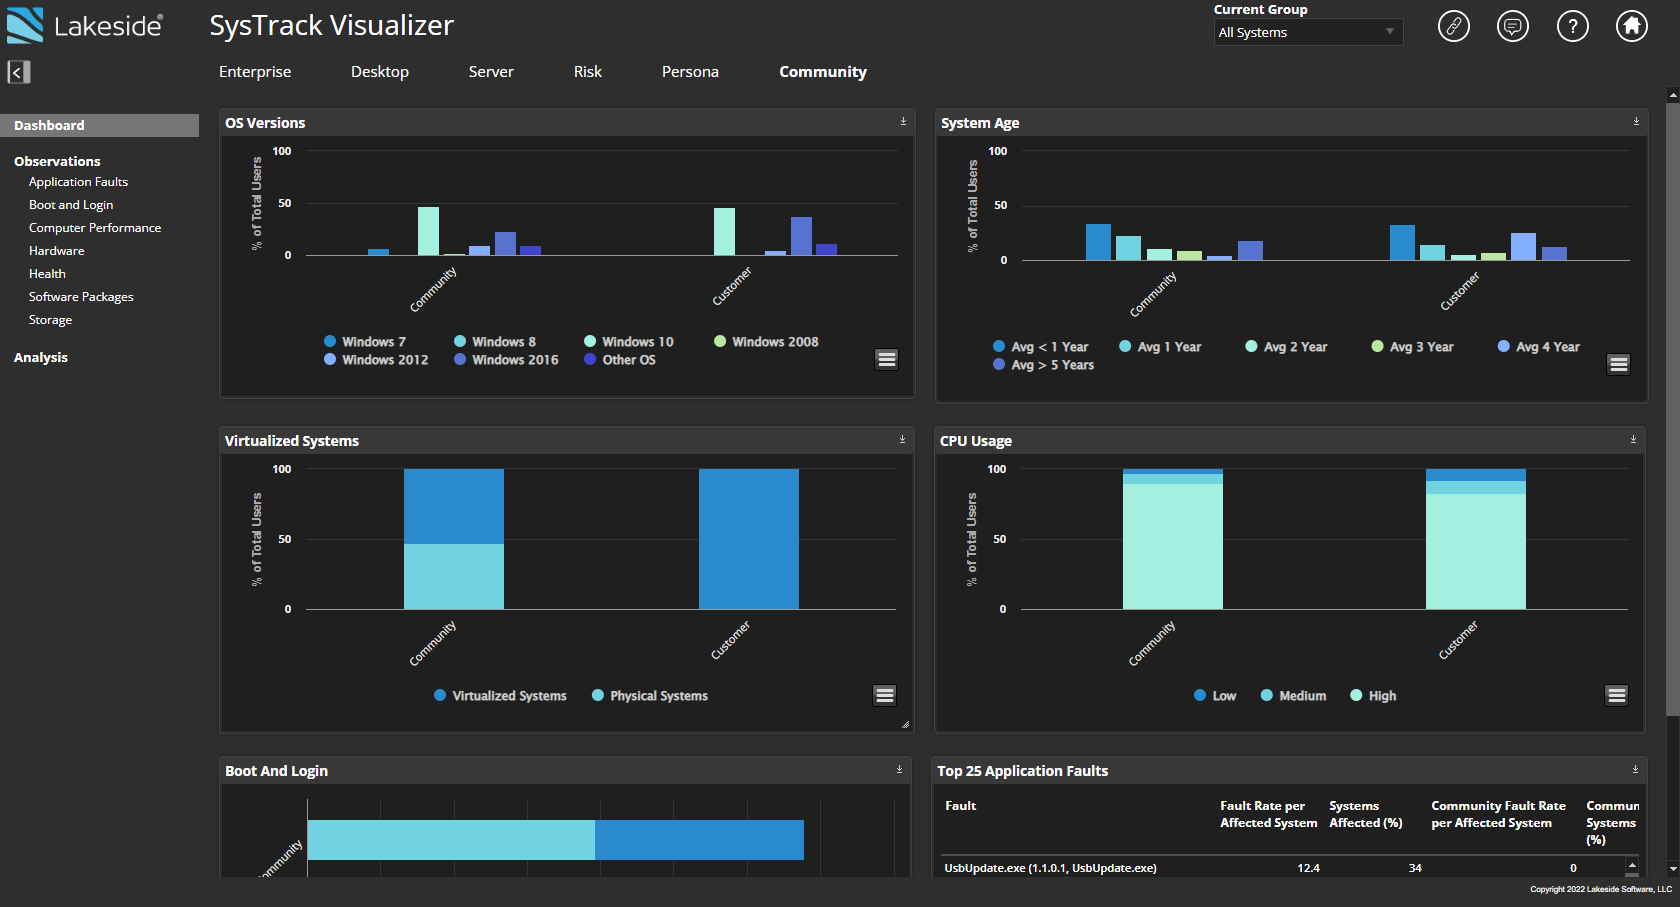
For more information on how to view detailed information in any of the SysTrack Visualizer modules, see View Datasets.
Topics in This Section
On This Page