System Details
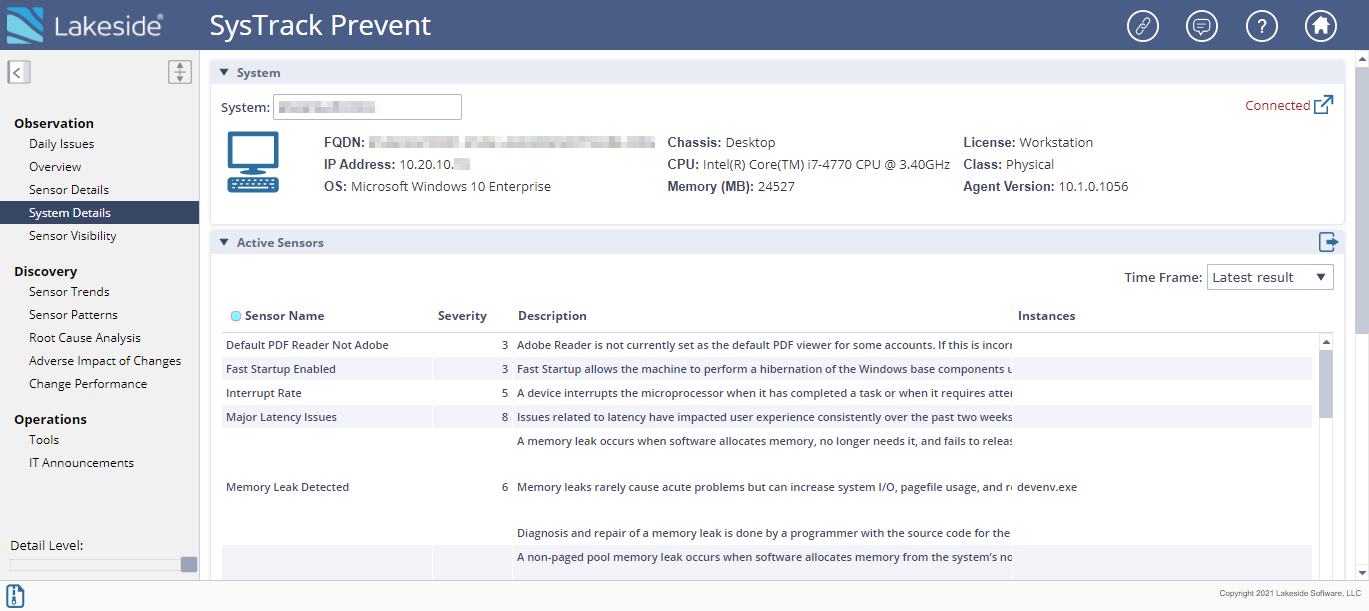
On this page, you can view relevant information about a particular system.

NOTE: When you click Connected, Resolve opens in the same tab.
The Active Sensors table contains a list of the sensors that are activated on this system, as well as their severity level and description.
You can adjust the Time Frame drop-down to view certain time frames in which the sensors were activated.
The Launch button in the upper right corner of the page takes you to SysTrack Resolve if the system is currently connected. In Resolve, you can take a deeper dive into the activated sensors on this system in the Sensor Category Details section. Once there, you can select a sensor in the Sensor Category Details section and view its description in the Selected Sensor Details section.

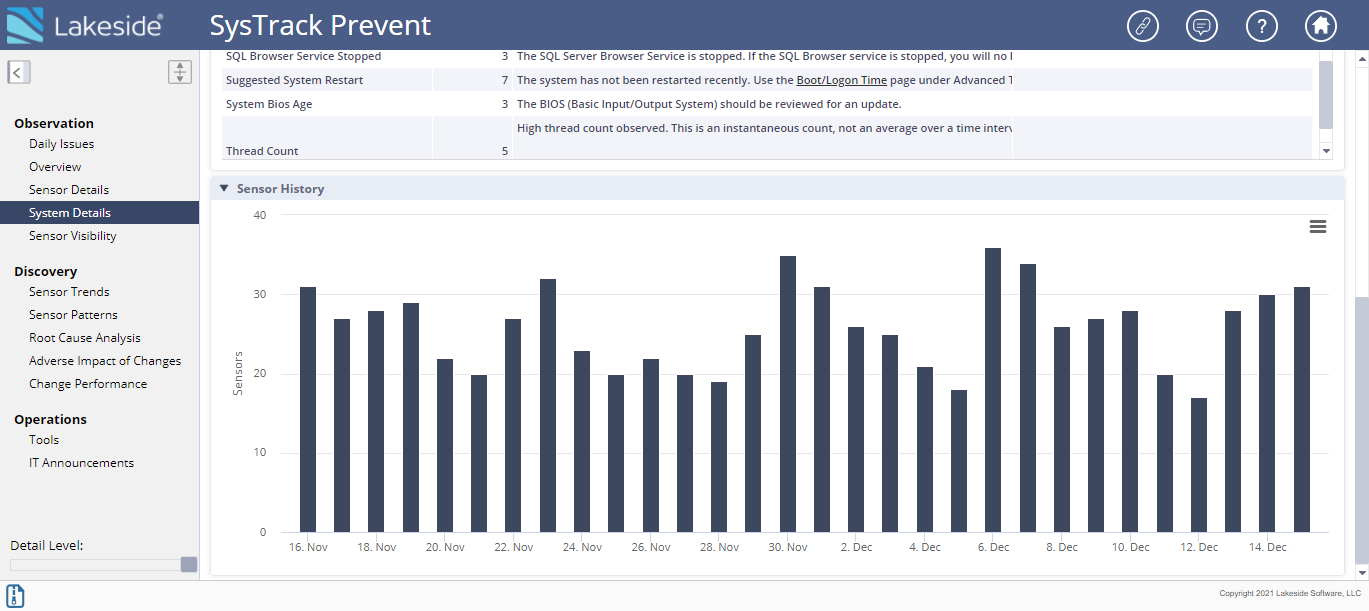
The Sensor History graph contains the trending history of sensors on the selected system. You can view the number of sensors that activated on that system for a particular day. If you click a day in the Sensor History graph, the Active Sensors table will update to display the sensors that were activated on the selected day.
On This Page