Surveys User Guide
Use this dashboard to display results for any Survey.
NOTE: This dashboard only supports up to 10 questions. If a Survey has more than 10 questions, only the first 10 are displayed in the dashboard.
Surveys
The Surveys table provides a list of Surveys in the environment, showing only those Surveys with at least one response. It also displays the number of users who have answered the Survey and the total number of responses.
Selecting a Survey from this list filters the rest of the graphs and tables in the dashboard. The Responses Over Time graph shows the total number of responses over a timeline.
Survey Questions
As you scroll down, each graph and table analyzes the Survey questions, dynamically populating the page to reflect the number of questions in the Survey.
The type of question dictates the data display format. User input influences both the data received and its presentation. Each question may feature distinct elements across different graphs.
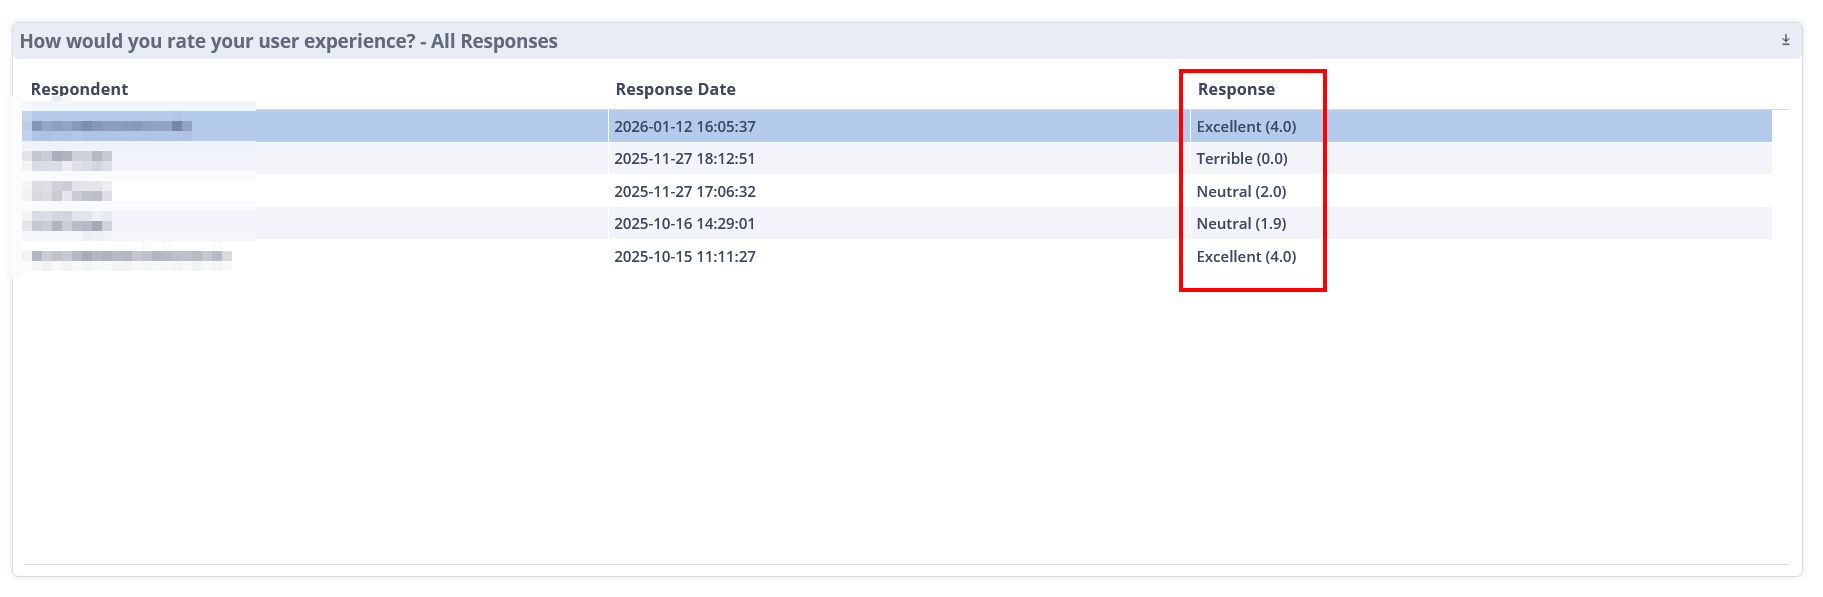
In the Response column, the number in parentheses is the number on the slider in the Survey.
For text response questions, SysTrack employs sentiment analysis to assign a score to each response. The bottom right section displays a list of complete user responses, including the entered text, the assigned score, and the corresponding sentiment.
On This Page