AppVision Application
Usage
For usage data to show for a specific group, the group must be enabled for real-time under its definition in Configure. "Usage" is not available by default in the cloud.

IMPORTANT: The Fair Usage Policy states that the number of groups enabled for real-time is a maximum of 25. We do recommend you set this to less than 25 as it considerably increases the amount of data agents will send to the cloud master.
Usage in AppVision gives you application averages on a time line graph which does it to scale so you can see it aggregated across the enterprise for the entire estate.
You can search directly for an executable (application) or search for a package first to narrow down the application search.

If the check box for View entire group is not checked, then no data will load if a system is not specified. For On-prem version 10.5, the UI does not show an error or otherwise indicate that a system must be specified if the check box is not checked.
For On-Prem version 10.10+ and the cloud, if no system is specified and the check box is not checked, the system text box shows a red highlight.
You can choose the Time Window by the drop-down menu which includes the following options:
Custom, Last 24 Hours, Last 7 Days, Last 30 Days, Last 90 Days, Last Year, Last 3 Years
NOTE: Data on the Usage page is only available for the last 30 days.

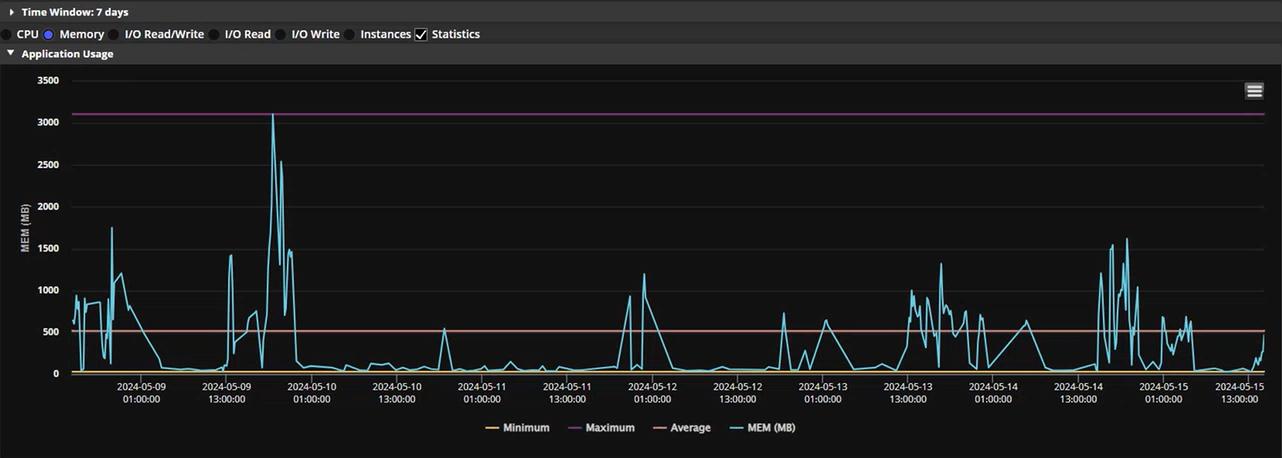
You can choose to view the graph by CPU, Memory,
I/O Read/Write (I/O = input/output disk), I/O Read, I/O Write, or
Instances - The number of instances the executable is running. For example, if you have three teams processes across two systems, you have six instances.
Statistics - If checked, shows the straight lines through the graph which represent minimum, average, and maximum.
Modules
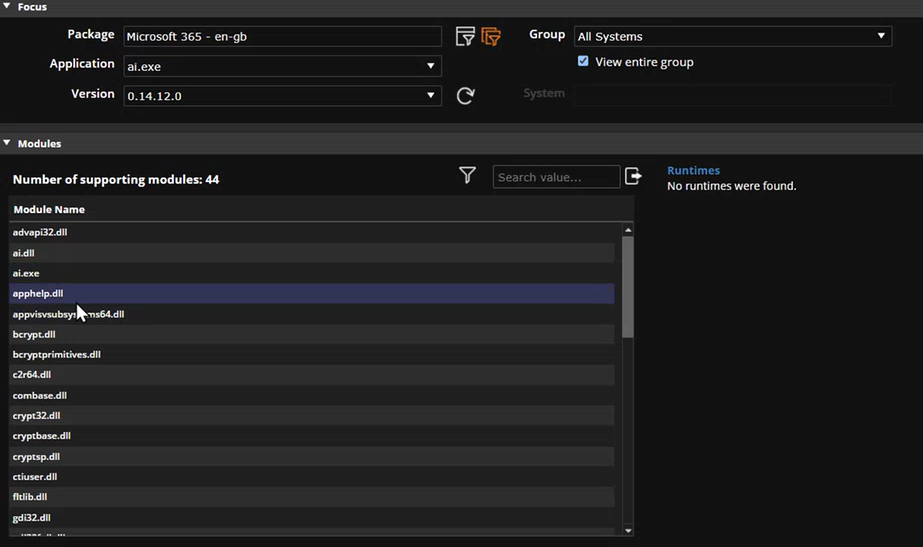
Helps to identify what the associated files are in a package. For example, if you have Microsoft 365, there are a lot of programs included in the package which include runtime files, library files (dll), and support files.
You can filter by package or application.
Filtering by package is useful for application mapping.
Connections
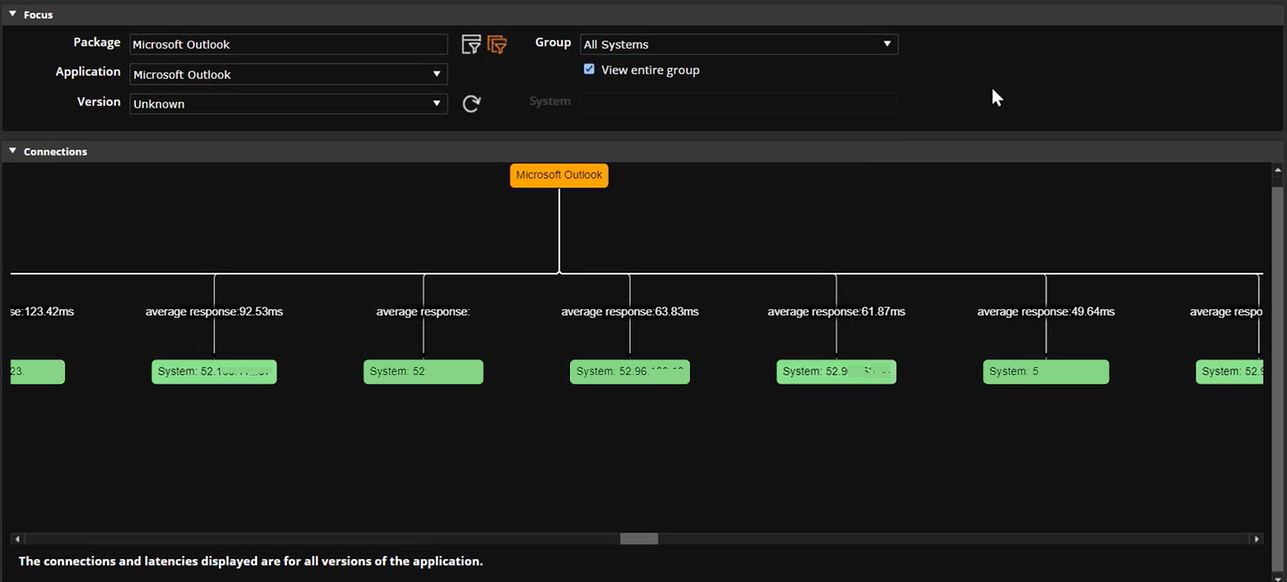
Is similar to dependency mapping in Resolve, but it is for one application across the entire enterprise.
Network
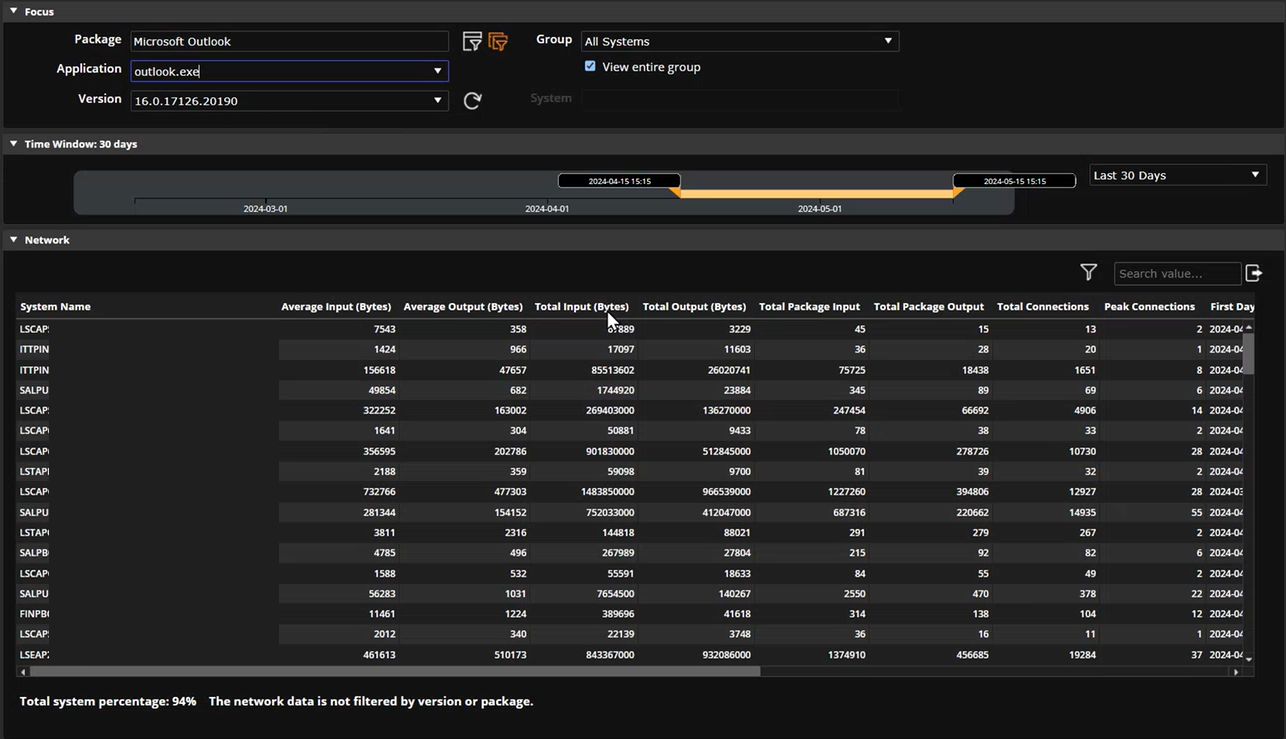
Shows the network usage and bandwidth by device for the Last 24 Hours, Last 7 Days, Last 30 Days, Last 90 Days, Last Year, Last 3 Years throughout the enterprise.
Virtualization
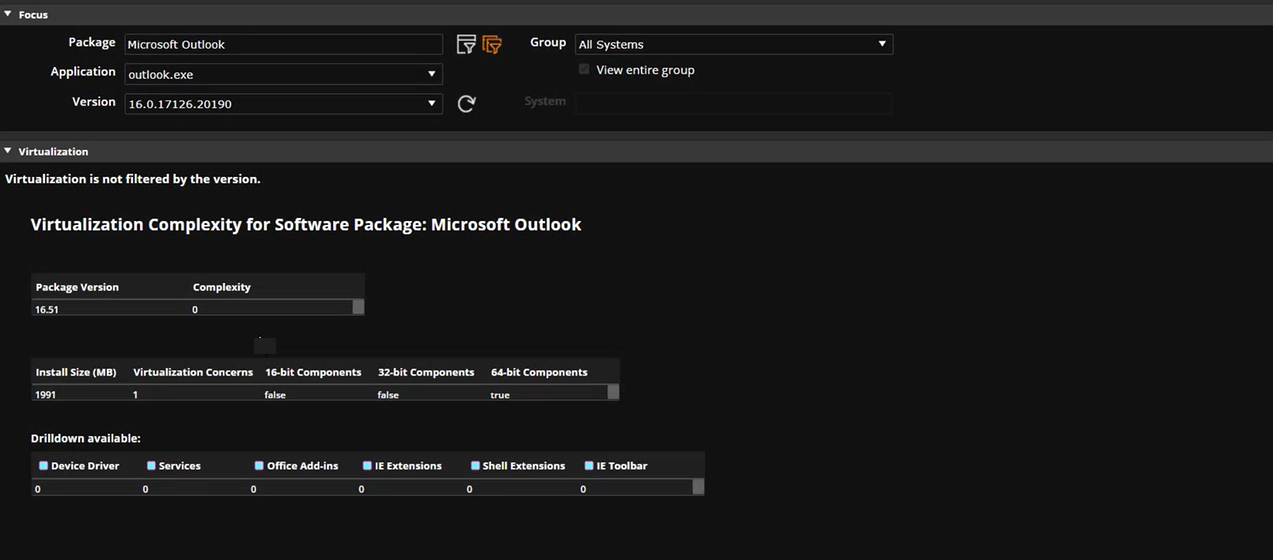
The dataset that is in Visualizer > Observations > Application Virtualization is also found in Virtualization. You can view the virtualization complexity for a software package by version, complexity score, install size, concerns, components, and you can drill down by device driver, services, Office Add ins, and shell extensions.
Installations
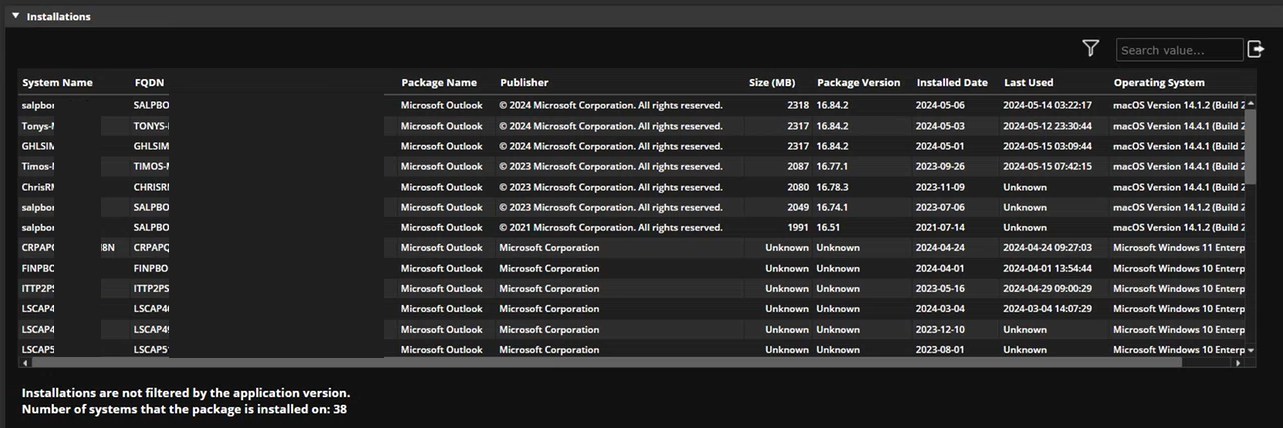
Shows where the software is installed, what package it is part of, the publisher, size, package versions, installed date, last used, and operating systems.
Faults
The dataset that is in Visualizer > Observations > Application Faults is also found in Faults.
On This Page